Long-Term Expected Return of Collectibles

Long-Term Expected Return of Collectibles

Executive Summary

  • Stores of value represent an alternative asset class compared to stocks, bonds, and real estate. Examples include gold and silver bullion, many cryptocurrencies and NFTs, collectibles, and art. Stores of value do not generate income, and while most have some utility, their primary financial use is to hold value over the long-term in line with inflation and global wealth.
  • Gold bullion and gold jewelry make up most the store of value market cap at $12 trillion. The global art market is valued at over $1 trillion. The crypto market recently peaked at $2.9 trillion. The global collectibles market is much smaller, in the $500 billion range. By comparison, the global market cap of bonds, stocks and real estate are many multiples of world GDP, on the order of $500 trillion.
  • The current investment environment is favorable to stores of value as a partial replacement for bonds as part of a diversified portfolio. Store of value assets provide inflation protection, portfolio volatility moderation, and should outperform treasury bonds over the next decade as the Fed holds rates below inflation. Store of value assets are also underowned among U.S. investors, compared to the massive wealth invested in financial assets.
  • Collectibles and art have historically produced real returns of 2-3% before transaction costs, which is much better than prospective government bond returns. Collectibles and art are also unquestionably a climate-friendly asset, which can’t be said for crypto or the gold mining complex.
  • Collectibles and art are not suited for a managed fund format or as part of a professionally managed portfolio. Low liquidity and high transaction costs force hold periods to be a decade or longer. Patient buying and selling is a must, which is generally not allowed with funds owned by pools of investors. Fund management fees would likely be high and seriously dent the benefits.
  • Collectible investments must be personally held, which has many pitfalls. An investor must dedicate a lot of time to understand the field, the pitfalls and how pricing and grading works. For most investors, this is not worth the effort. For a passionate collector, or sophisticated asset class trader, investing in this space could be nicely profitable over the next decade.


Introduction

Each store of value has its pros and cons compared to others. All require a fundamental belief or leap of faith that future buyers will pay ever rising prices. Gold has served as an excellent store of value for many millennia, yet most investment advisors and institutional investors shy away from a gold allocation. There’s no income, and it seems so backward to value a shiny yellow metal so highly. Yet gold is highly liquid and has returns that are uncorrelated with stocks and bonds.

Professional investors are inching their way into cryptocurrencies, pushed by their clients and FOMO, even though crypto is so new and excessively volatile. Bitcoin, the largest of them, is viewed as an improved digital gold because supply is capped at 21 million bitcoins. Digital gold also comes in the form of a low-expense ETF holding gold bullion in a bank vault. Yet, gold supply is expected to grow forever, which caps long-term expected returns.

A third class are collectibles and art. Collectibles, art, and various rarities have a long history of holding value. U.K. auction houses Sotheby’s and Christie’s were established centuries ago, in 1744 and 1766 respectively, to serve collectors and investors in this space.

The adage among financial advisors is that collectibles are not an investment. This is generally good advice. Yet, the collectibles asset class has attracted a resurgence of investor interest since the global pandemic emerged two years ago. There are many reasons for the renewed interest and rising prices.

First, new innovative technologies and platforms have greatly increased access and attracted attention. Collectible fractional ownership platforms such as Collectable, Dibbs and Rally are growing rapidly. A new art form and collectible technology, non-fungible tokens (NFTs), and platforms to purchase and hold NFTs such as OpenSea, have exploded in popularity with over $40 billion in sales in 2021.1 These platforms allow a user to own a portion of a rarity and conveniently monitor holdings on their phones.

Another reason to pay attention to this asset class has been the massive increase in crypto, real estate and stock market wealth, which is feeding into the demand for digital art, collectibles, and all sorts of rarities. Wealth growth drives the demand for rarities. In a sense, investing in collectibles is a bet on the continued growth of private wealth in America, a bet that may zig and zag differently than stocks and real estate.

The uber-rich have more than enough resources to support their lifestyle, and thus we expect some of their wealth to ultimately find its way into various rarities and stores of value. With respect to storage and hassles, it’s much easier to diversify away from paper wealth with gold, compared to buying ten homes, 50 cars, a private island or a few yachts. You can’t take that wealth with you in a hurry. Art was the primary collecting interest of American tycoons in the 1800s. Since the mid-1950s, collectibles have emerged as a competing asset class.

Conventional investment management thinking also has more investors seeking inflation protection as government debt-to-GDP ratios and deficit spending are at all-time highs throughout the developed world. Inflation may be the only palatable “tax increase” governments can use to reduce debt-levels over time. Collectibles and all stores of value have a history of being good inflation hedges.

Another means to slowly lower debt-to-GDP levels is to hold government bond yields below inflation. This central bank action is often called financial repression. I fully expect government interest rates at all but the longest maturities to stay below inflation over the next decade or longer. The U.S. is not alone in being stuck with ultralow interest rates. Japanese yields have been near zero for two decades and the Eurozone has experimented with negative interest rates for ten years. Figure 1 shows a chart of the real U.S. Fed funds rate over time.


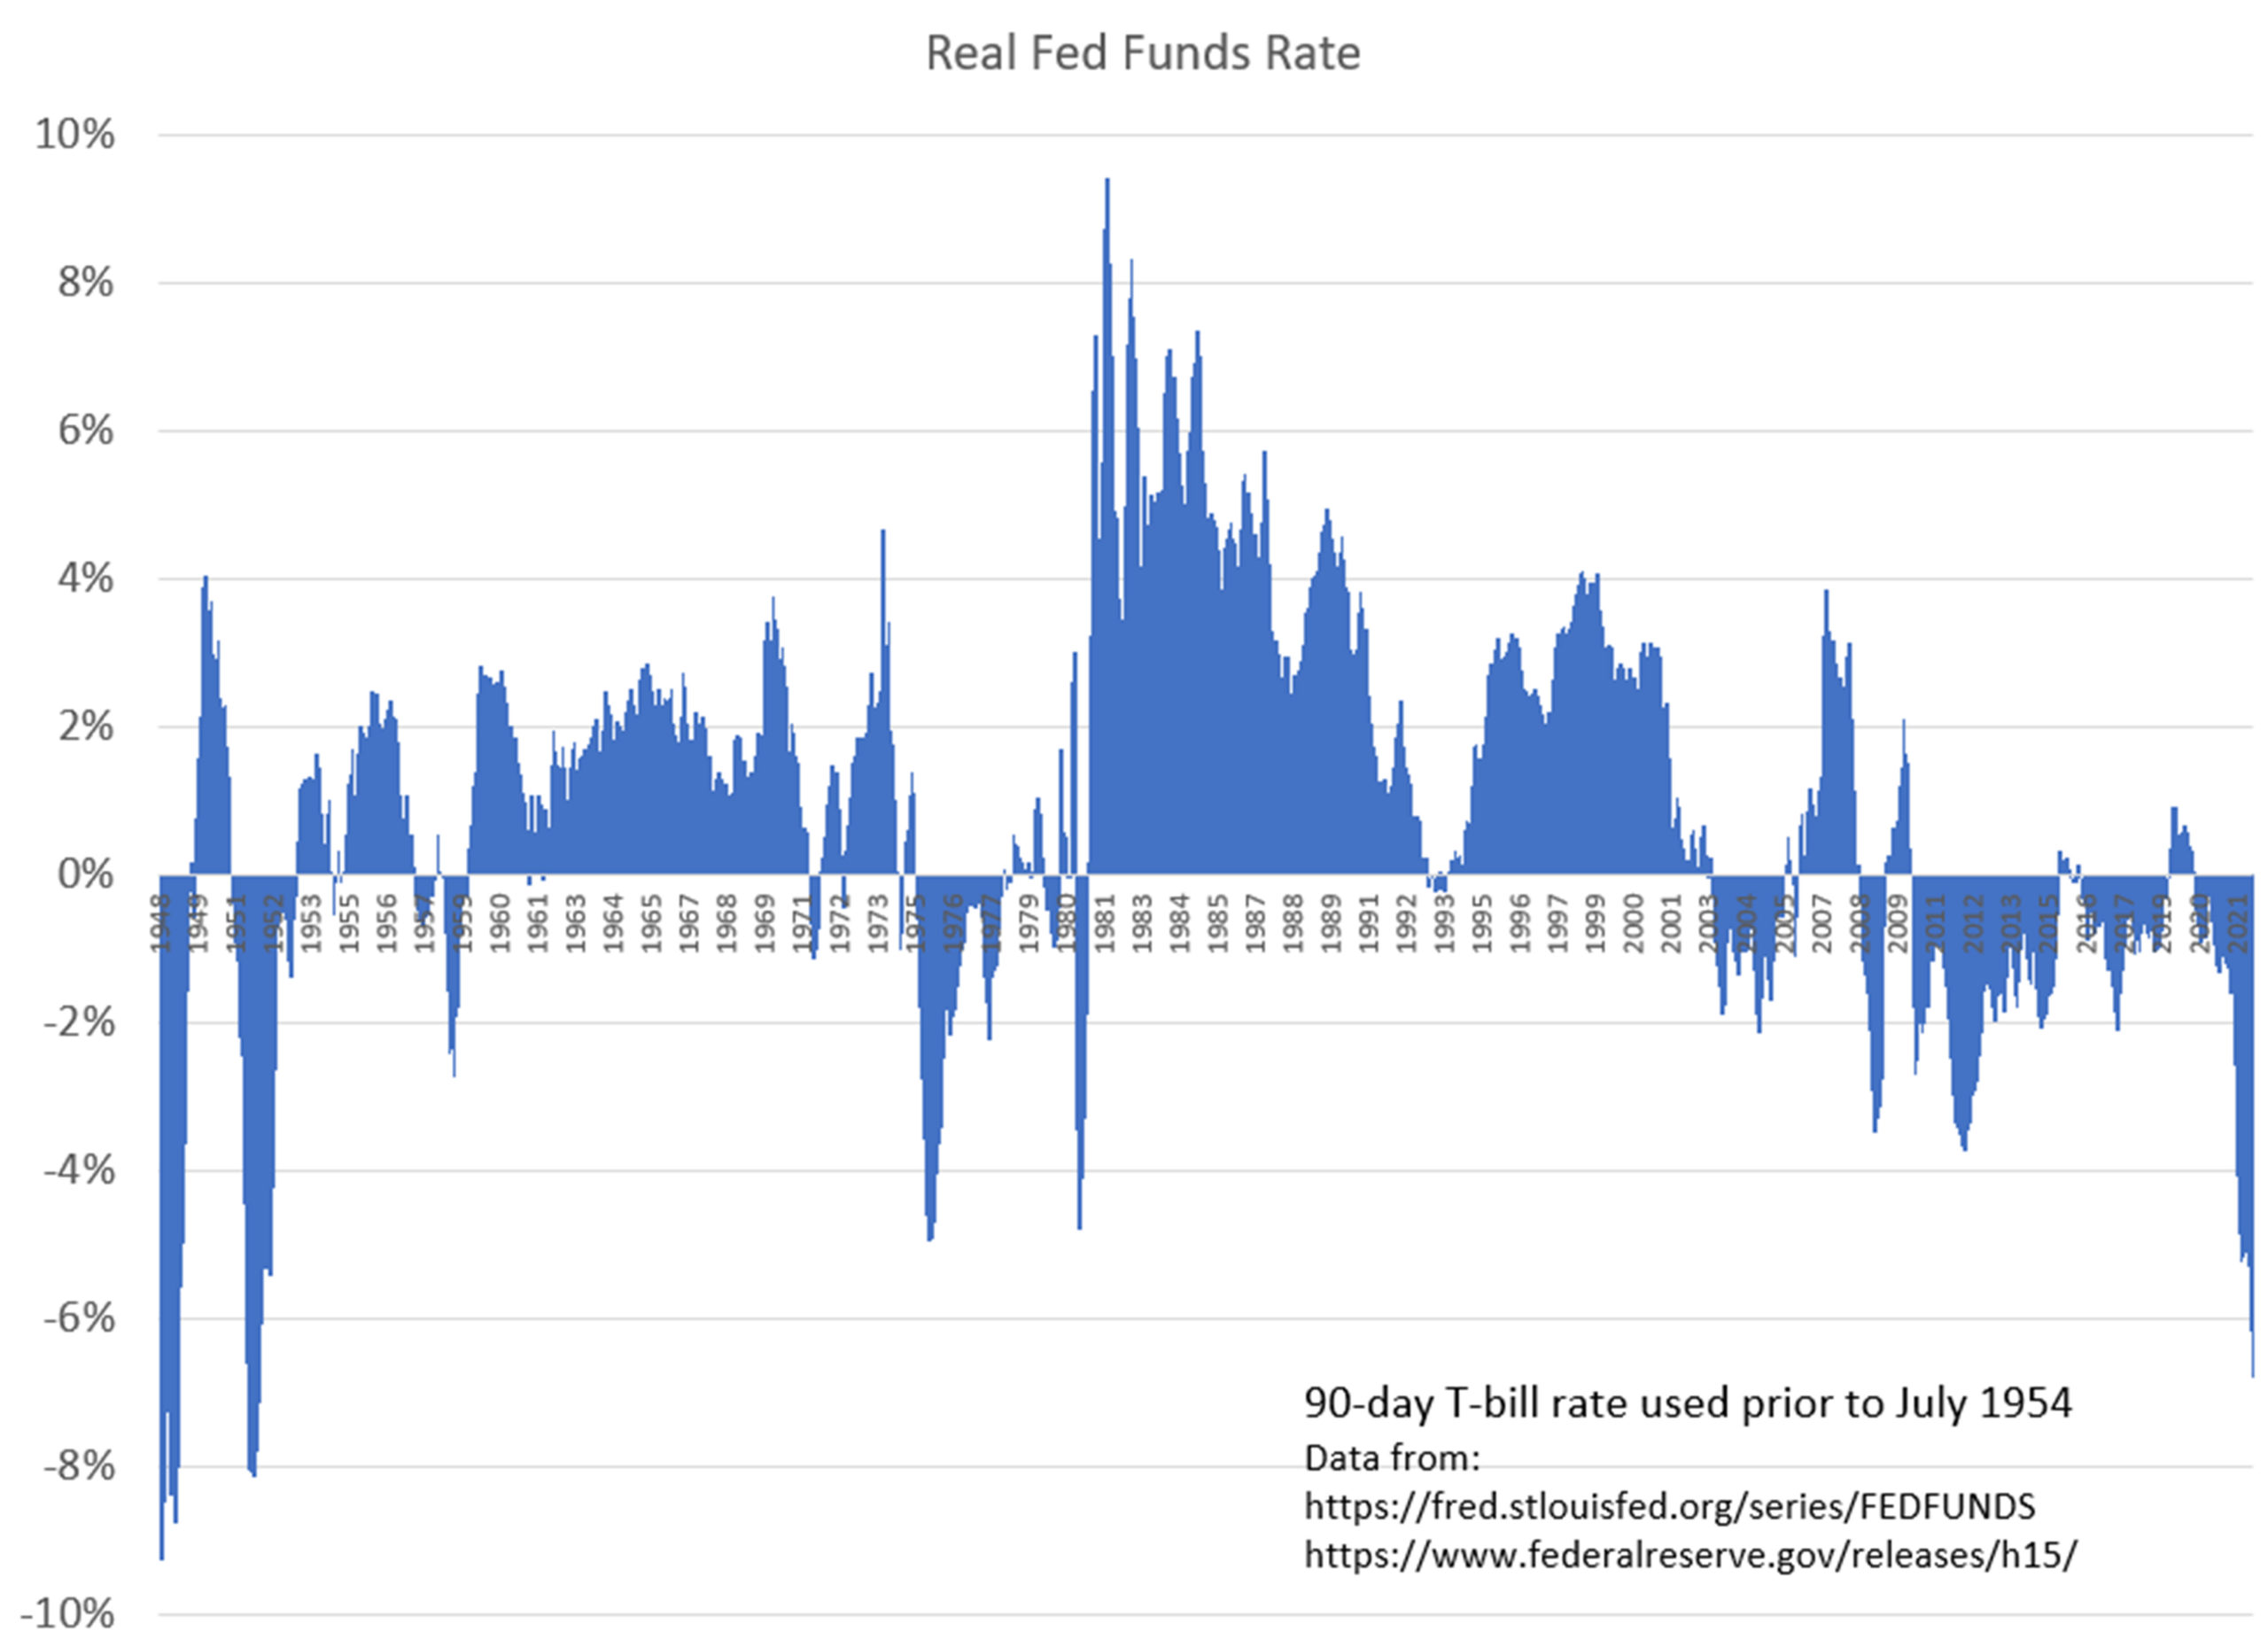
Figure 1. Real Fed Funds Rate in the Post-War Period.


The Fed is stuck in a box. I’m sure they’d like to increase interest rates to a level where conventional monetary policy can once again be used to manage the economy and inflation. I’m sure they’d like to unwind their balance sheet significantly. Unfortunately, significant interest rate hikes and/or quickly unwinding the balance sheet will likely be met with equity bear markets, falling real estate prices, recessions, spiking unemployment, and much more of the U.S. federal budget shifted to paying interest. No one wants any of that, so I don’t expect the Fed chair to jeopardize their job by raising rates too high or too quickly. Also, when the inevitable recession does occur, expect short-term rates to quickly fall to zero once again.

With such a backdrop, government bonds look extremely unattractive. Total returns net of inflation will be negative even if rates remain range bound over the next decade. Investors at all levels are searching for an alternative to bonds; in particular, an asset that can deliver small but positive real returns while also serving as a portfolio ballast during equity bear markets. Gold was discussed in a previous blog post.2 For this article, I’ll assess that long-term expected return for collectibles and rarities such as art, sports memorabilia, rare stamps, and rare coins.

Proponents of collectible investing suggest equity-like returns uncorrelated with stocks and bonds. Such claims are often misleading based on short periods of historical returns while ignoring numerous costs and fees. More care is required to assess long-term expected returns using many decades of data.

Fortunately, there are a few good academic studies addressing this question. Long-term expected real returns of art and collectibles are in the 2-3% range. That’s better than gold at 0-1% net of inflation, better than bonds (in normal times) at 0.5-1% net of inflation, but lower than stocks at 5-6% net of inflation. Later in this article, I’ll review the historical evidence and the simple reasoning for collectible expected returns.

Looking forward, stocks (especially U.S. stocks), bonds, and real estate all look expensive and overowned.2 Indeed, compared with GDP, market caps of all three major asset classes are at levels never seen in history. Store of value assets are underowned on a secular timescale just as inflation is reemerging and real interest rates are expected to be significantly negative for many years to come. A real return of 2-3% is very attractive as long as the correlation with equities remains low. The process of investors diversifying away from financial assets, and adding to the store of value asset class, should push collectible pricing higher and produce attractive returns over the next decade.


Non-Financial Social Returns

Unlike buying bitcoin or gold, the world of collectible and art investing offers more than financial returns. For passionate collectors, there is fun and satisfaction in slowly building a collection, learning about the history, and being part of the hobby’s social sphere. National conventions can bring the like-minded together, and bidding in auctions can be exhilarating.

There are no ETFs for this asset class, so allocating capital takes time. Each purchase is like a mini long-term investment. Learning about the ins and outs of the hobby can also take considerable time. Understanding the grading process as well as pricing nuances is essential. Effort must also be made to minimize the potential for “black swan” losses due to fraud, theft, and disaster.

Ownership of collectibles can also serve to signal wealth and status, which most humans seem to like. Everyone loves bragging rights. A previously unknown rich person can become instantly famous and enter their name in the history of the field simply by being the highest bidder or amassing the biggest collection. Proceeds associated with an eventual sale can go to charity, thus gaining karma points and social praise.

Finally, collectibles and art are the green investments in the store of value space. Cryptocurrencies use excessive amounts of electricity. Gold mining also generates greenhouse gases, at least for the new supply. Much like existing gold stock, collectibles do not contribute to greenhouse gas emissions.


Long-Term Returns of Gold

To determine how collectible prices grow over time, lets first start with gold – the safest store of value with the longest history of inflation protection. As of 12/31/2021, the world’s supply of gold is worth about $12 trillion, which is an order of magnitude greater than the bitcoin market cap at about $0.9 trillion. The world art market is estimated to be about $1 trillion and the world’s collectibles market is estimated to be worth $300-$500 million.3,4

Over the past 500 years, gold has delivered a historical return that roughly matches inflation.2 Thus, a real return of 0%/year or CPI + 0% as I sometimes say. This makes sense, as with all commodities, that price trades near the marginal cost of production, which increases with inflation over time. New gold supply, produced by the world’s gold miners, has grown at a rate of 1.6% a year over the last 100 years. At times new supply has been a low as 1.2% and as high as 1.9%. New gold supply is not responsive to demand shifts due to the long-term nature of developing gold mines.

Interestingly, the U.S. dollar gold price has gained 1%/year in real terms since 1900. Most of that growth occurred when the world shifted to a fiat currency system in the early 1970s. Real GDP growth has been about 3% per year, thus the difference is about what annual production has been since 1900 (about 1.6%/year). Since 1970, residential home and land prices have also grown at rates above inflation, which may reflect the immense growth of financial wealth associated with stocks and bonds pulling the value of gold, collectibles, cryptocurrencies, homes, and land up at rates higher than inflation.2

The idea that aggregate wealth growth drives demand for stores of value is fundamental to expected returns. Investors are expected to diversify a small portion of their assets into stores of value. How investors parcel assets among the stores of value will vary over time. So far, in the history of finance, gold has not become obsolete as a financial asset, even though it’s been known as the “barbarous relic” among many famous economists for almost 100 years. The entrance of bitcoin and other cryptocurrencies to the scene is another potential threat to gold being the premier store of value.


Model of Expected Financial Returns of Collectibles

Collectibles and art hold a nebulous rarity premium above and beyond the materials cost associated with the item. Expecting a collectible to hold value over time does involve a leap of faith, but most investing does. Attempting to understand and apply logic to relative pricing can be very frustrating. For example, a banana duct taped to a wall sold for $120,000 at Art Basel Miami Beach in 2019.5 A good story can increase value, including a story of something selling at an absurd price.

In the collectibles space, rarity most often trumps beauty and popularity, but for many items popularity or an “IT factor” is more important than beauty, historical significance, and rarity. Prices can be anchored at high levels for decades. Ultimately, collectors want confidence that an item can be sold at a higher inflation-adjusted price in the future, and thus seek items with a combination of rarity, consistent and high demand from collectors, historical significance, and a history of high prices.

While relative pricing can be confusing, price increases over time do seem to follow a general rule over the long run. Compare the gold supply dynamics with the premier rarity in each collectible universe – the one-cent magenta postage stamp, the best-conditioned Honus Wagner T-206 baseball card, the rarest and most sought-after rare coins, and masterpiece paintings. These are one-of-a-kind highly desirable rarities. As global wealth grows over the decades, there is no additional production of such an asset.

Thus, we expect prices of such rarities to grow over the decades with national and/or global wealth growth rates. Since wealth generally grows with gross domestic product (GDP), we expect:

Annualized Return of High-End Collectibles ~ Annualized Return of GDP

Historically, GDP has grown 5-6% in most developed countries, or 2-3% after inflation. The equation above definitely shows the direct inflation protection provided by collectibles. The run-up in collectible prices as inflation peaked in 1980 is one example of this relationship.

The equation also shows how the growth in wealth has a gravitational pull on the store of value market cap. As the market cap for stocks, bonds, and real estate grows over time, the need for stores of value also grows. With gold, price increases are moderated with new supply. With top-shelf collectibles, only price can grow to keep up with global wealth.

Of course, there are many factors that strongly affect realized returns over a long hold period, including:

      1. Relative attractiveness of collectibles compared to other asset classes such as stocks, bonds, gold, and real estate.
      2. Trends in wealth inequality, the geographic distribution of wealth, and wealth/GDP.
      3. Changes in preferences and popularity of a collectible compared to other and newly emerging collectibles and stores of value.
      4. Novelty/adoption premium associated with a new collectible.

With respect to buy and sell execution:

      1. Purchase and sales fees, such as buyer’s/seller’s premiums charged by auction houses.
      2. Carry costs such as storage, insurance, time, maintenance costs and investment fund fees.
      3. Buy price compared to a long-term intrinsic value.
      4. Sales price compared to a long-term intrinsic value.

Factor 1 suggests that the store of value asset class must be compared with the attractiveness of other asset classes.2 In 1980, many collectibles and gold were trading at extreme valuations as investors chased returns and worried about runaway inflation. Yet at that time, stocks and bonds were incredibly cheap. In 2000, gold was cheap, and stocks were expensive. Currently, it appears that stocks, bonds, and real estate are all very richly priced compared to store of value assets.2

Factor 2 suggests a positive correlation of high-end collectibles with equity markets, and that is indeed seen in historical data. Many collectibles and art markets peaked in 1990 (Japanese Bubble) and in 2008 (the Great Financial Crisis). Dimson and Spaenjers suggest that all collectible price indices greatly understate true price volatility due to infrequent trading and appraisal-based pricing. This is identical to comparing the volatility of privately held real estate with REITs and comparing private equity with publicly traded equity indexes. Unsmoothing returns suggest that collectibles have equity-like volatilities and a higher correlation with stocks.6

Essentially all investors like the idea of adding privately-held equity assets to smooth portfolio returns. This diversification benefit is not illusionary. There are many equity bear markets that don’t affect private valuations. During the 2000-2002 bear market, private real estate values and most collectibles were unaffected, while the stock market lost over 50%. In these cases, the diversification benefit is real. Another advantage of private assets is they can’t be sold easily, which can keep investors in the game during periods of stress. Equities can be easily sold by a scared investor in a panic, which usually leads to later regrets.

Factor 3 suggests that buying and holding a collectible that ultimately goes out of style can be costly. Wealth demographics change, and new tastes can affect returns. Dimson mentions seashells as a previously highly valued collectible in the late 1700s.7 Many collectibles fail to establish themselves among rich collectors. Beanie babies is one example. Even ancient coins and art, which have been valuable for centuries, can go out of favor during a lifetime.

Factor 4 indicates that finding an emerging collectible, just like finding an emerging start-up or artist, can produce immense returns. Lately, many new stores of value have entered the space, including cryptocurrencies, NFTs, and video game cartridges.

Factors 5 and 6 represent the significant costs of buying, selling, and holding collectibles. Most collectibles are illiquid. Prices can move considerably when only a few buyers are interested. Collectibles also take considerable mental time to research, buy and sell through either a dealer or auction. Some purchases have sales taxes.

Transaction fees in the collectible space are very high, which effectively pushes hold times to a decade or longer. U.S. rare coins, with a huge dealer network, typically have a bid/ask spread of 20-25% around the mid-price. Auction houses charge buyer’s premiums of 15-20%, which essentially reduces the sales price compared to the mid-point fair value price. Acting like a dealer or market maker in this space can help minimize these costs.

Some collectibles have significant carry costs. A collectible automobile must be serviced and maintained. All must be safely stored and insured. For art and wine, storage and insurance costs are estimated to be 0.5%/year.8 For storable rarities such as rare coins, stamps, and trading cards, storage and insurance costs should be very low (~0.1%/year).

Finally, Factors 7 and 8 account for opportunistic and/or unwise purchase and sales at prices below or above a theoretical and unknown long-term intrinsic value of the asset. Buying into a rush of rising prices, or near a bubble peak will dramatically reduce long-term returns. Buying at highly depressed prices and selling into a bubble ten years later can offer superior returns.

Shown in Figure 2 is the growth of a U.K. Stamp Index (in orange) net of inflation versus real U.K. GDP growth (in blue) both indexed at 100 in 1899.6 It’s impossible to know the true long-term intrinsic value of a collectible at a given time, and it depends on more than just GDP level. Yet, common sense suggests that when the U.K. Stamp price index diverged far from the GDP line, that perhaps prices were due to mean revert. Certainly, in 1980 U.K. stamps appeared to make a bubble top, much like many inflation hedging assets. Any parabolic blow-off top is likely far above intrinsic value. Alternatively, after stagnant prices for a decade or longer, we could guess that prices may be at or below intrinsic value.

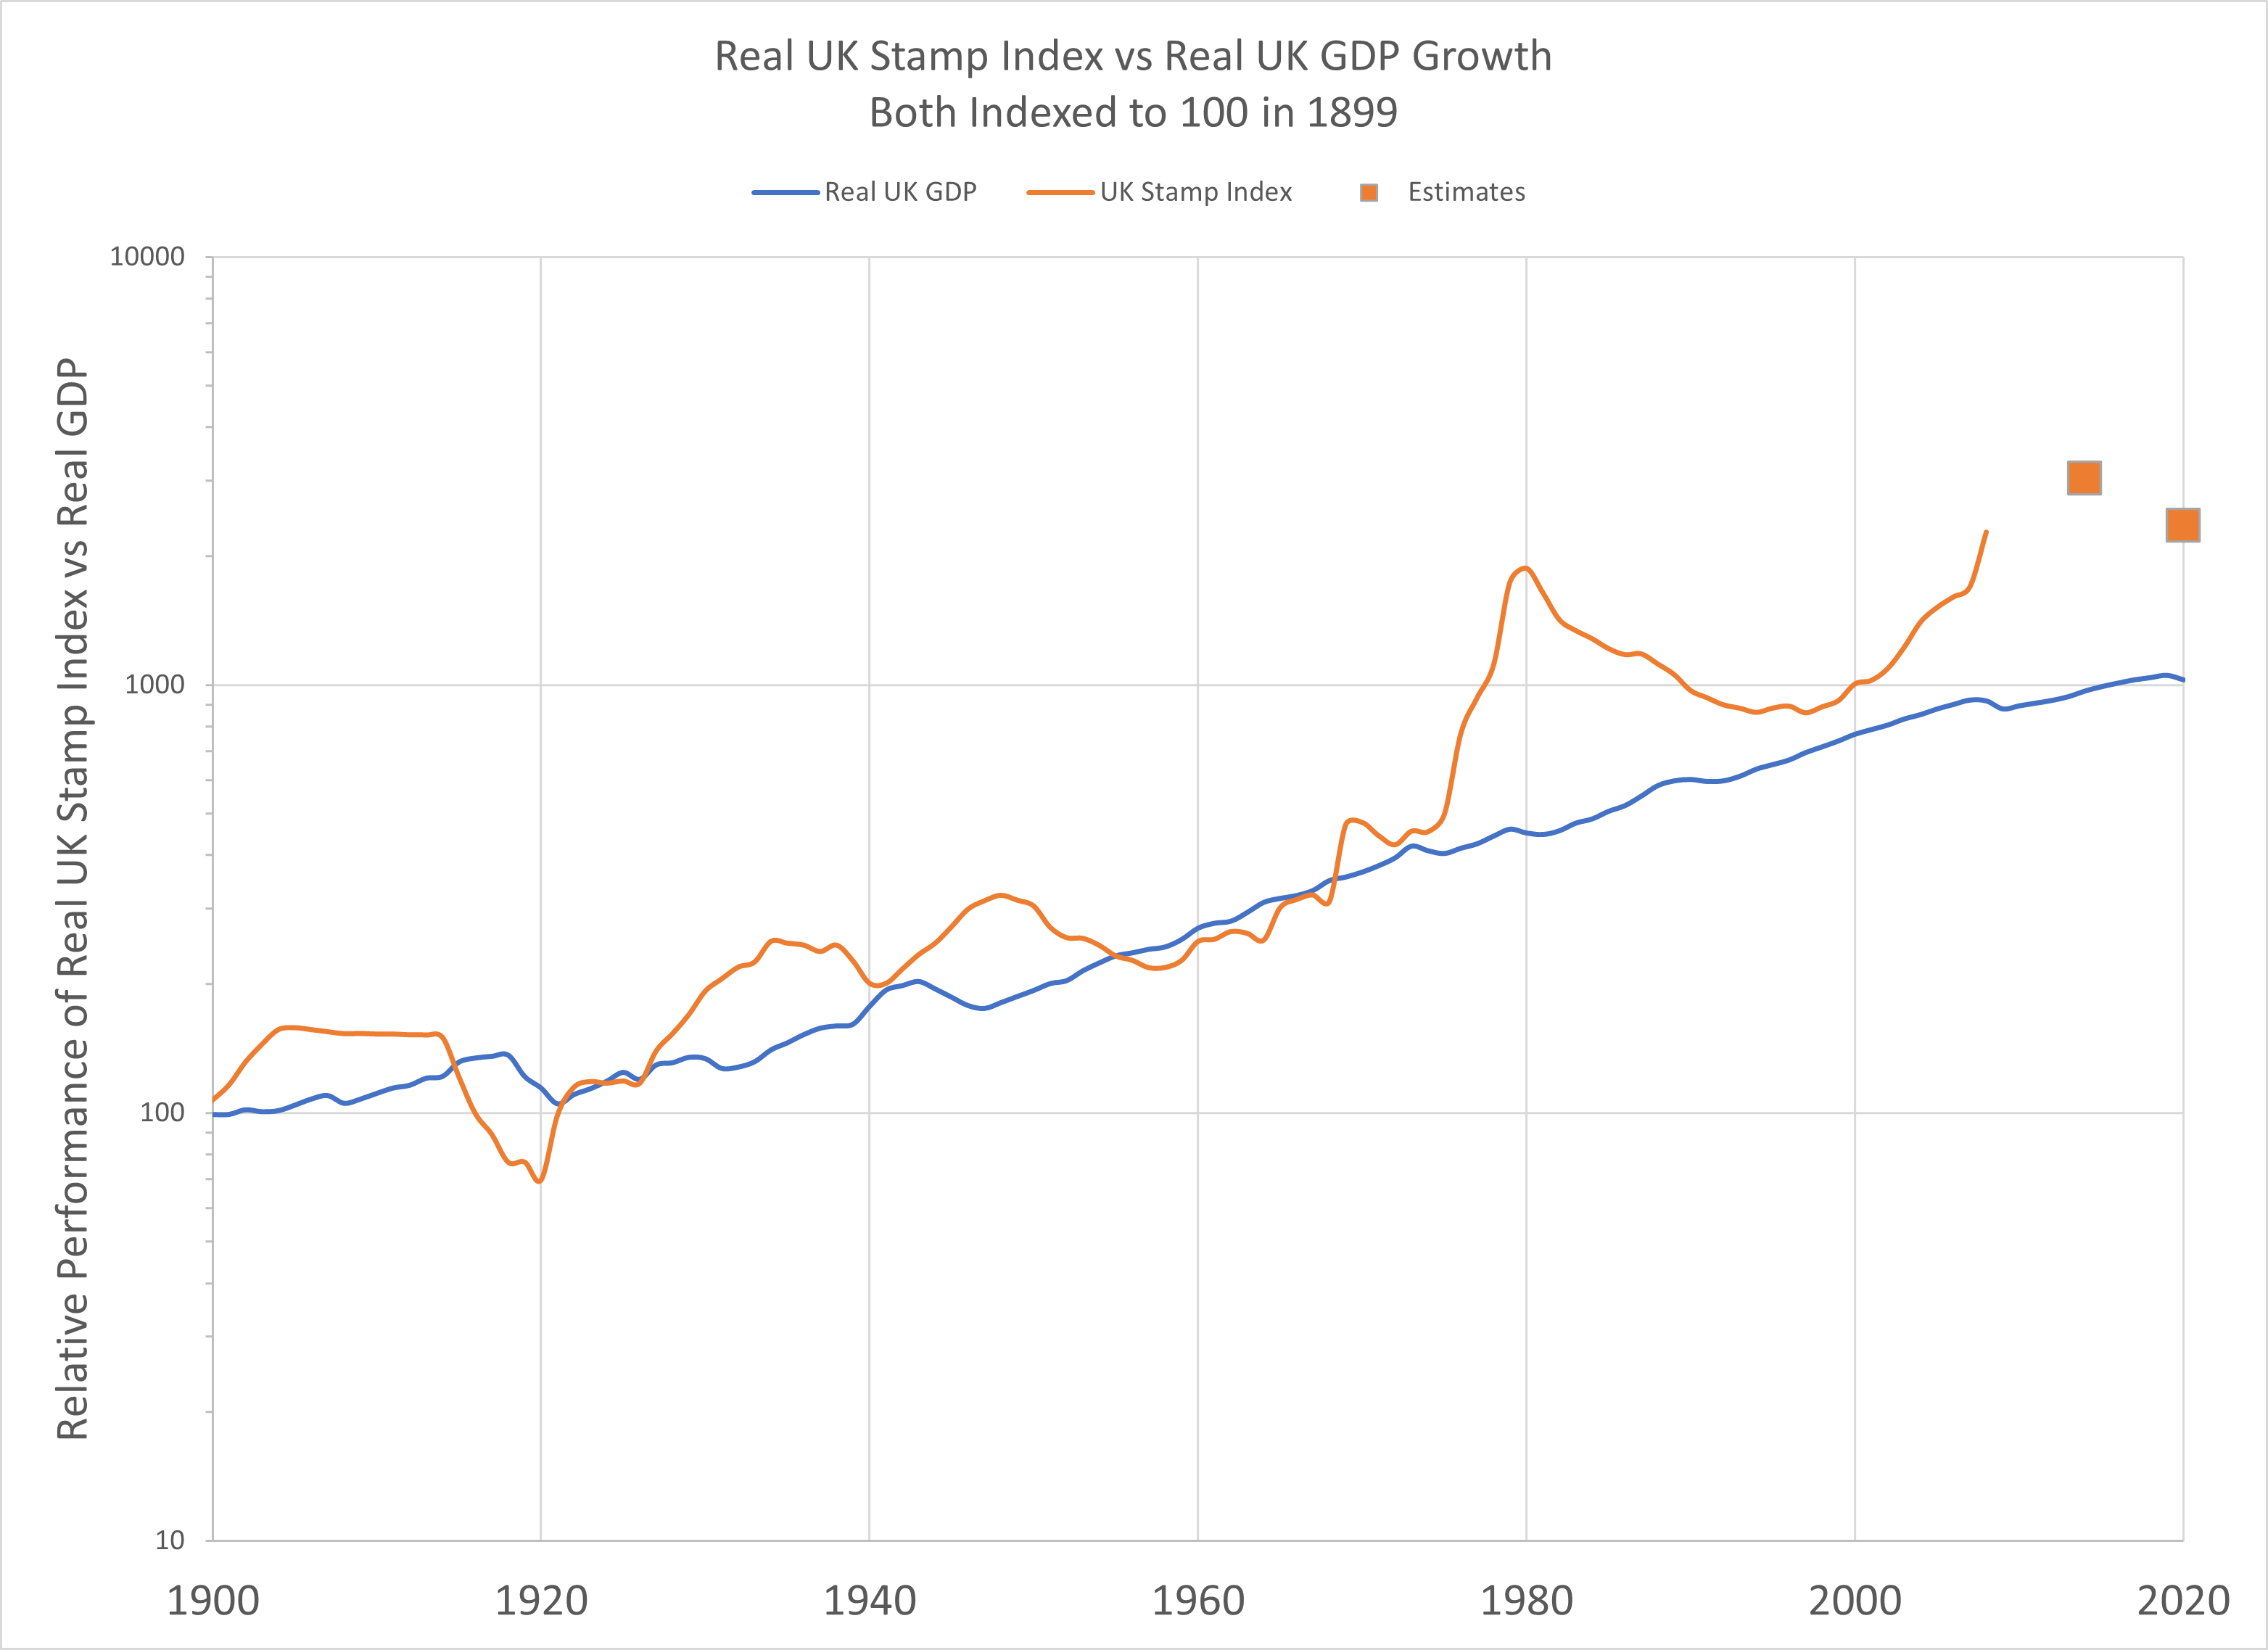
Figure 2: U.K. Stamp Price Index from Reference 6. Pointwise estimates made after 2007.


To summarize, the following formula can be used to estimate future annualized returns (R):

where n is the hold time in years, D% is the bid/ask spread as a percentage of the mid-point price, Rnom GDP is the nominal GDP growth rate which can be very high during periods of high inflation. CC% represents the carry costs as a percentage of value over time. The ratio of P/IV is the purchase or sales price compared to long-term intrinsic value at the time. While IV is unknowable, we can make an educated guess that it rises smoothly over the long-term with nominal GDP.

Selling rarities into a blow-off top may also allow a collector to sell near an ask price, rather than hitting a bid. Buying when everyone is selling may allow a collector to buy near a bid price, rather than at the ask. Patience and “buying right” are critical for achieving decent returns in this asset class. And as an asset class trader, we can always look to other asset classes when capital can’t be deployed efficiently in the collectibles space.

The above equation also suggests why a pooled fund structure holding collectibles will likely underperform. A long hold time, n, is required to minimize the impact of transaction costs. Most private fund structures avoid hold periods greater than 10 years. Funds holding pooled assets will generally be forced to buy and sell with investor flows or due to an arbitrary liquidation date, which is the opposite of being a patient trader. Plus, fund providers will want to charge a management fee of 1-2% per year and likely a cut of the profits, which seriously eats into long-term expected returns. Fractional ownership platforms, such as Collectable, can potentially sidestep many of these issues.


Historical Evidence

We need to examine the returns of collectibles with a long history of prices. Comic books, sports memorabilia and trading cards do not have a long history and shorter return periods benefit from the novelty premium. Even with considerable pricing data, such as with U.S. rare coins going back to the 1950s, the effect of improved standardized grading can dramatically enhance returns of the highest graded items, and depress returns associated with lessor samples. These are one-time return effects.

We must also acknowledge that survivorship bias may creep into results. Many original works of art are purchased, yet resale value falls over time when the artist never becomes adopted by collectors. There may be 100% loss on such investments. Other collectibles are hot for a while, yet don’t have the staying power to generate lots of auction activity and sustain the interest of collectors over decades and centuries. Examples from a century ago or longer include tulips, seashells, and souvenir silver spoons. Since the 1950s, Hummel figurines, vinyl records, Thomas Kincaid paintings, and beanie babies have all lost their luster among high-end collectors.

Figure 2 shows the real price of U.K. stamps since 1900 compared to real GDP. This index is constructed using the most expensive U.K. stamps, and thus the premier rarities in the philately field. From 1900 to 2021, the real U.K. Stamp Index grew at 2.9% per year compared to 2.1% real U.K. GDP growth.

Figure 3 shows the real growth of an Art index constructed with repeat auction sales of top tier art works over the last three centuries.9 Since 1765, the Art index has grown at a rate of CPI + 3% in British pounds. Notice how prices peaked at various stock market peaks in financial history. Indeed, since this study, art also peaked in 2008, and has fallen about 50% net of inflation since.10

Art was the name of the game among the ultrarich in the 1800s, and it appears the growth rate outpaced the long-term average up to the 1873 financial panic. John Pierpont Morgan held a considerable fraction of his wealth in art when he died in 1913.11 Perhaps there was a bit of novelty premium in that growth. From 1873 to 2007, the art index is up about 2% real, which is identical to the U.K. GDP growth rate during that time frame.


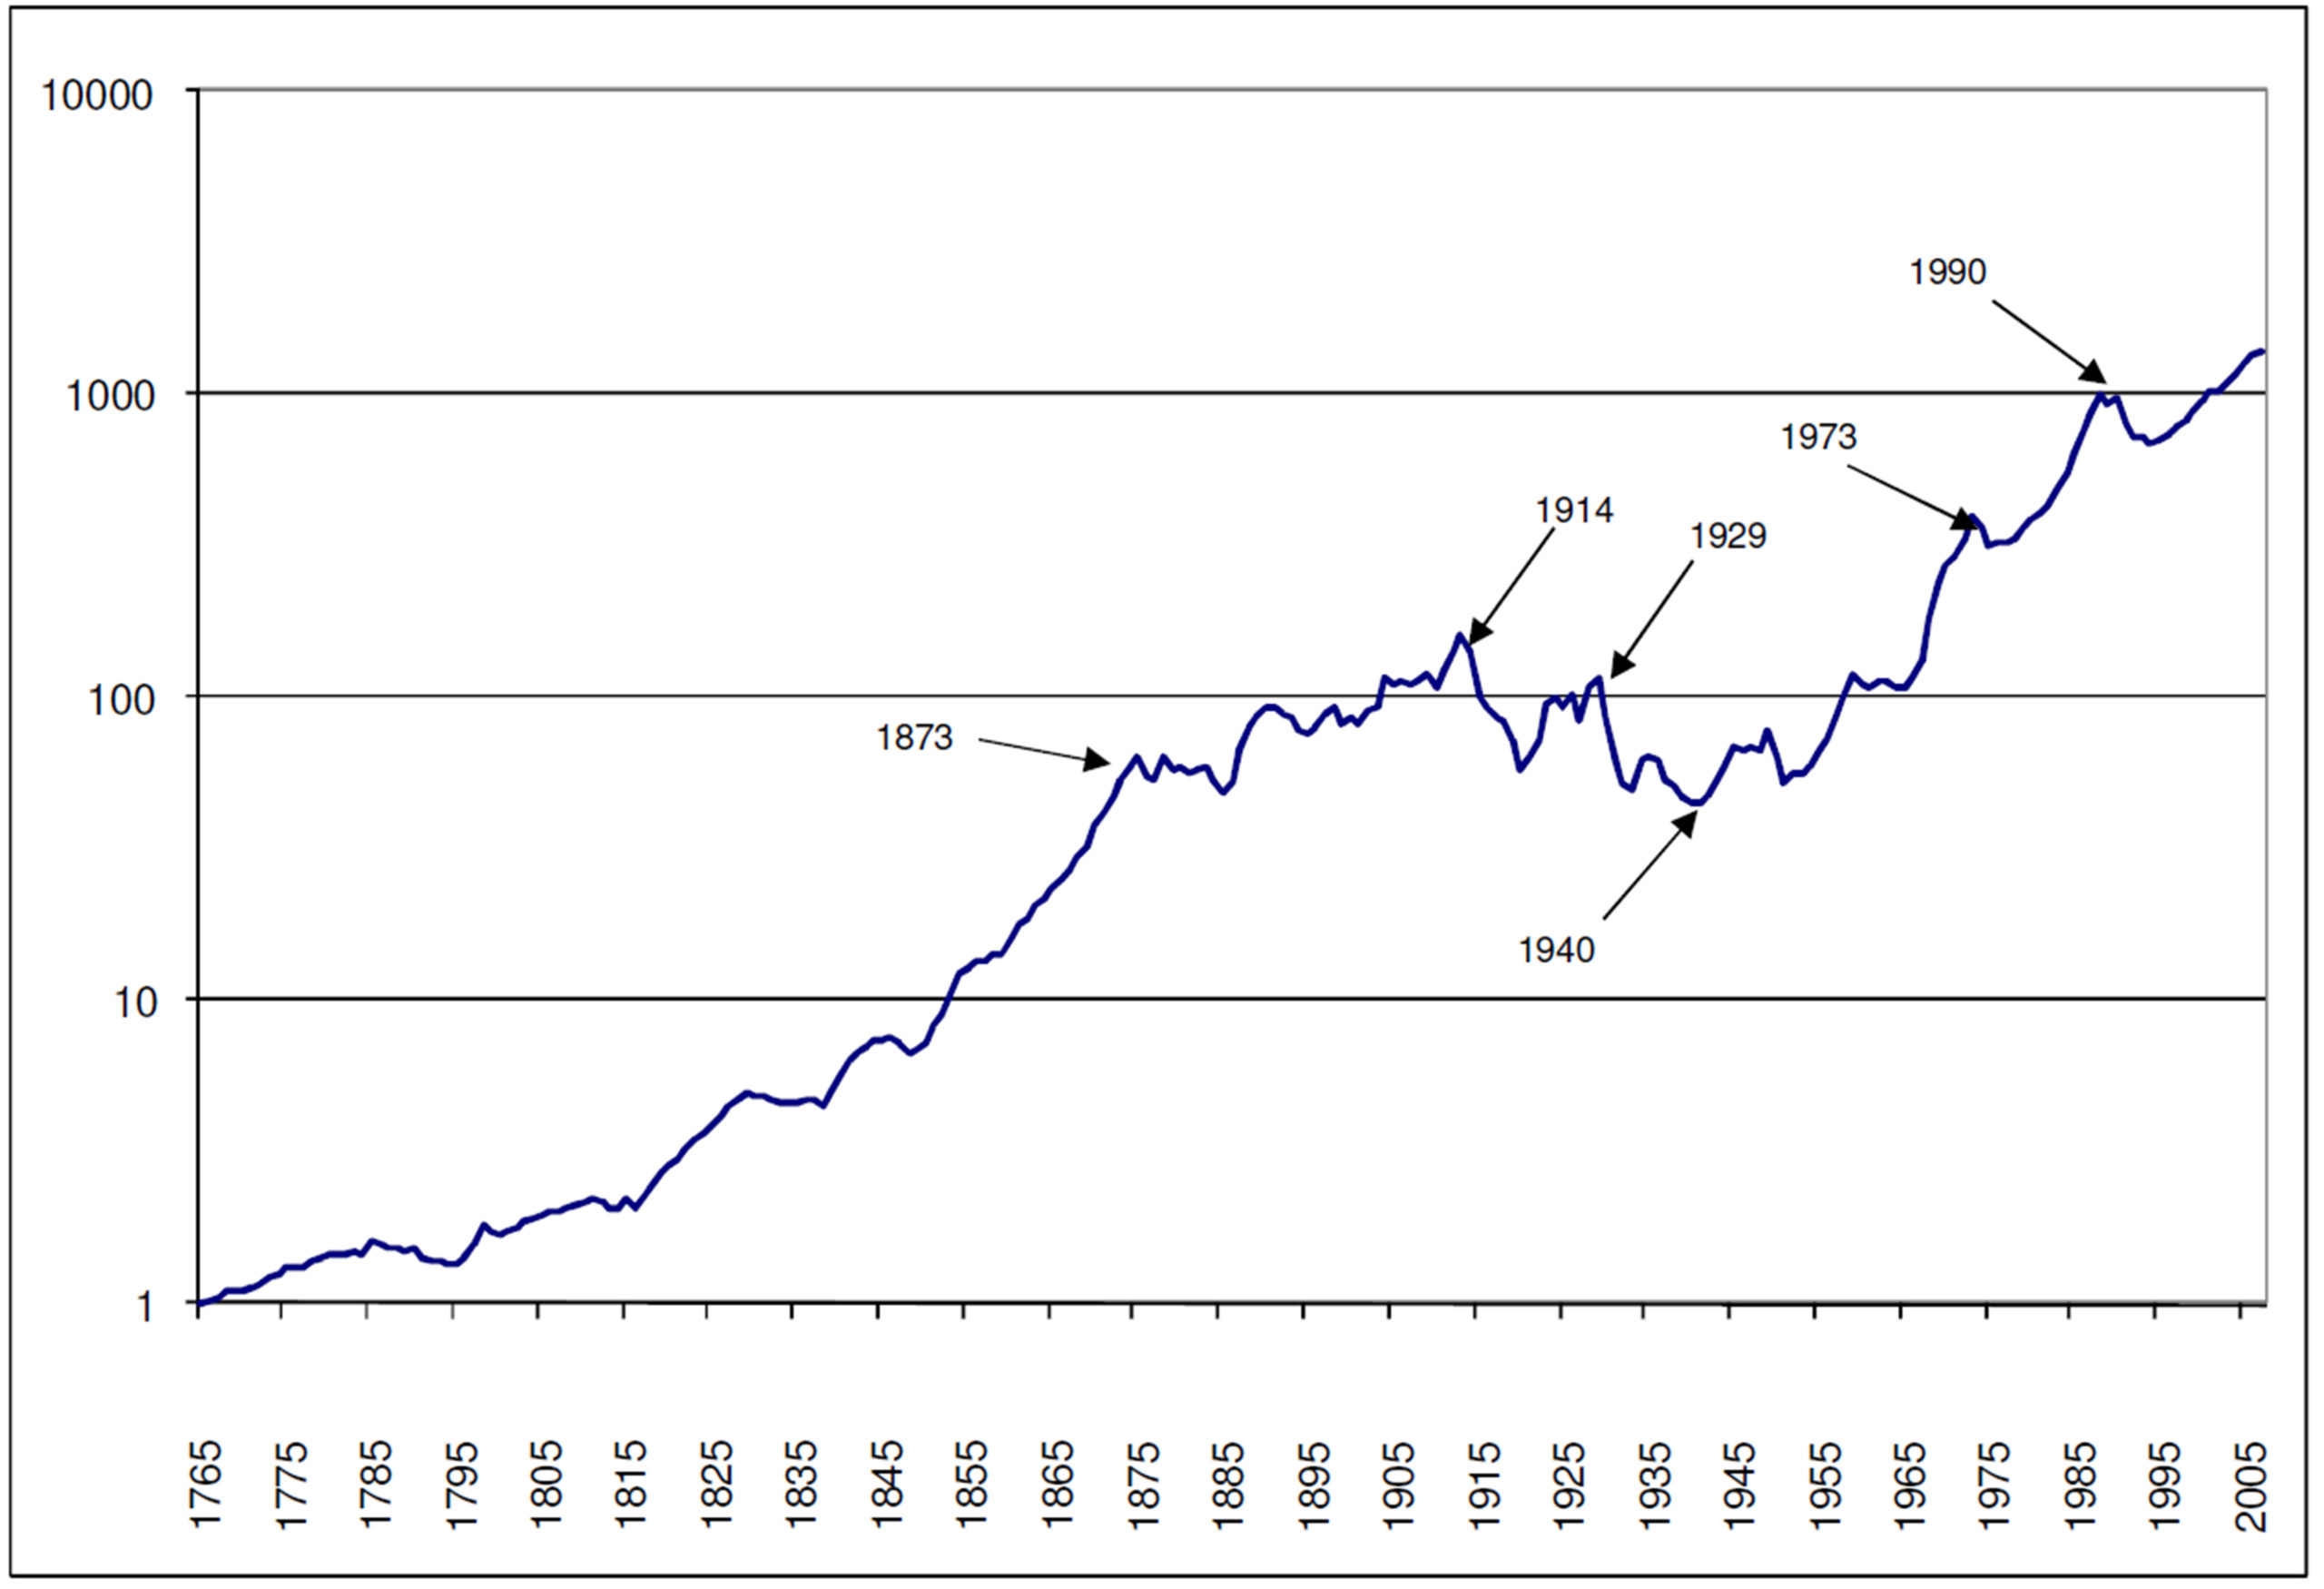
Figure 3: Yearly Real Art Price Index in GBP from Reference 9. Index value in 1765 is set to 1. This chart shows the growth in art values net of inflation.

The next chart, Figure 4, comes from the 2018 Credit Suisse Global Investment Returns Yearbook.8 The chart shows the real returns of various rarities from 1900-2017 in US dollars (USD). Over that time U.S. GDP grew at 6%/year while inflation was 3%/year. The average of all the collectibles was CPI + 2.9%, while stocks delivered CPI + 5.2%. Art grew at 1.9% real, stamps at 2.6% real, violins at 2.4% real, and fine wine at 3.6% real. Note that indices for jewelry, autos, and books do not go all the way back to 1900.

As seen in both Figures 3 and 4, there was a Great Leveling12 in wealth that occurred during the two world wars and the Great Depression. Global wealth as a percentage of GDP fell, along with a dramatic reduction of wealth inequality. Figure 4 also shows that while collectibles and art held their value versus inflation, they were cheap by the 1950s, along with equities. We can assume that all collectible prices in the 1950s were priced below long-term intrinsic value.

 Figure 4. Real returns of various rarities in USD. From Reference 8.


Recent stamp auctions show similar results. The most expensive stamp in the world, the British Guiana 1-cent magenta was auctioned on June 8, 2021 at a price of $8,307,000 at Sotheby’s. Almost 100 years ago (in 1922) it sold for an astronomical $32,000. That’s an annualized return is 5.8% per year matching U.S. GDP growth.

In the U.S., famed PIMCO bond king Bill Gross sold a significant portion of his stamp collection in multiple auctions between 2018 and 2020.13 Like-item sale prices going back to the 1880s are shown in Figure 5. To produce this chart, I selected eight historical items with extensive provenance and indexed recent sales to 100,000. An exponential line fit shows price growth at 6.2%/year while U.S. GDP grew at 5.7%/year during that 133-year period.

As a final example, Figure 6 shows a price performance table for a representative sample of U.S. proof silver coins with moderately low mintages (~1000). Data is obtained from PCGS, which has extensive price information for rare coins of many grades and price levels going back to 1970. The grade for each coin was chosen to represent a quality rank of about 20-80. Since 1970, returns for these moderately priced coins have grown on average 6.9% per year which is well aligned with 6.3% U.S. GDP growth and the 7.5% growth in U.S. household wealth. Moderately priced rare coins suffered a 30-year bear market since the slabbed-coin bubble of 1989. Now prices are perking up after a long slumber, and perhaps they trade below intrinsic value.


Figure 5: Historical sale prices of select U.S. stamps and covers indexed to 100,000 in 2018 and 2020. Data in reference 13.

Figure 6: Price performance of U.S. Silver Proof Coins with estimated quality rank between 20 and 80. Data from PCGS and links supplied in chart.


What about sub-tier collectibles?

So far, we have shown historical returns of premier collectibles, often one-of-a-kind and highly desired, which currently trade at prices greater than $100,000 and often in the millions. But what about collectible pricing when there are thousands or even millions of specimens? There is a saying in the industry that the keys to buying collectibles is “condition, condition, and condition”, much like “location, location, location” in real estate.  Such an axiom is especially the case when professional grading is used to create conditional rarity among collectibles that have tens of thousands of samples.

Systematic professional grading got started with rare coins in the mid-1980s. This new technology allowed investors and collectors to buy standardized graded coins sight-unseen. There were many pitfalls with this approach, but enthusiasm around slabbed coins created a massive bubble peak in May 1989, which most rare coins have yet to surpass. Nowadays, many collectibles such as baseball cards, comic books, and video games are graded for pristineness which allows collectors to rank the best samples and use population reports to assess rarity.

Graded collectibles have a pricing structure that varies exponentially with grade quality. This was not the case before professional grading. Now the very best grades trade at an enormous premium, as wealthy collectors pay up for the very best and highest quality specimen. At the other end of the spectrum, there are many casual collectors holding average-quality collectibles such as baseball cards and comics with huge population counts. Such a collection holds very little rarity value and is unlikely to interest a professional dealer.

There is a middle ground, for collectibles trading in the $500-$10,000 range, that can certainly be used for investment purposes. Logic and carefully analyzed historical data suggest that similar long-term returns can be realized from these mid-tier collectibles. The table of proof silver coin returns in Figure 6 is one example.

What are the mechanisms to ensure similar long-term returns? First, collectors and professional dealers are keen assessors of relative value. Often samples that are graded one level below the top grade are still of excellent quality, and thus their prices tend to move in line with top-tier prices. Just as with real estate, pricing and appraisals of value are greatly influenced by recent sales of similar graded samples.

Collectors, investors, and dealers also perform relative assessments among the many different collectible types, thus ensuring this arbitrage mechanism can equalize long-term returns among many different types of rarities. At least in theory this should be the case, but in practice, the arbitrage process can be very slow.

Second, if top-tier pricing was truly expected to outperform over decades, the price gap between grades would become absurdly unstable. Collectors would be ever tempted to sell the highest graded sample and buy the next lower graded sample at a tiny fraction of the price. Perhaps, some sort of destruction arbitrage could become profitable to arbitrage steep relative pricing based on rarity.

Third, the mid-tier space makes up the bulk of the collectibles market cap and annual sales. While the highest-priced million-dollar items capture the headlines, their natural rarity means unit sales and quantity are quite low. Alternatively, expensive “investment quality” second and third tier items account for most of the market cap and sales. For example, see Figure 2.6 in reference 3 for the global art market. The lower the price point, the higher the total annual sales.

Finally, lower-priced collectables are more affordable for a larger number of collectors. There should be more demand for the mid-tier collectibles. Again, to emphasize, I’m talking about collectibles priced in the $1000 to $10,000 range. The box of 1980s heavily handled baseball cards in the attic are not worth much.

The bottom line is that we expect mid-tier collectibles to have similar long-term expected returns as the rarest high-end collectibles. We also expect prices of mid-tier collectibles to zig and zag differently than the million-dollar rarities. Often during price bubbles, when retail interest is immense, the low-priced product has the best percentage returns, although starting at very low base prices. We also expect secular trends to emerge from time to time that favor mid-tier collectibles, much like periods when starter homes outperform mansions, or when small cap stocks outperform blue chip large cap equities.


What about new supply?

Another issue we haven’t discussed is new supply. Every year, the supply of collectibles and art increases as artists create more content, governments mint more coins and stamps, and another year of sports memories are created. Most of this product has little rarity value, since all samples are of high quality, and many pristine samples are snapped up by collectors. New product providers often attempt to manufacture rarity with small limited-edition versions.

Another potential supply source is the repricing of collectibles produced a generation ago, as investors with money bid up childhood memorabilia. This is happening now with video game cartridges.

I suspect, but I’m not sure, that the annual new supply of rarity value is small (much less than 1%) compared to the size of the global art and collectibles markets. Historical returns, over decades and centuries of new supply, show that top-tier rarities are unaffected by new supply.

Of course, this doesn’t rule out the emergence of a new collectible form (such as NFTs) that may stunt future price growth of existing collectibles. There’s no doubt the emergence of cryptocurrencies over the past decade has stunted gold prices. This is just one of the risks of investing in stores of value.


Final Thoughts

In context of being an asset class trader, we must be open to possibilities in all asset classes. All stores of value look attractive at this time as inflation is reemerging, financial assets are heavily overowned and expensive, and real treasury yields are expected to be negative for the next decade. It’s hard to predict which store of value will do best in the future, so diversification is prudent.

Collectibles may be a good financial combo with gold and crypto assets. Gold is the ultimate safety asset in the store of value space with the lowest expected returns, but with returns that continue to be uncorrelated with stocks and bonds. Crypto assets are high reward/high risk stores of value, with equity correlations that continue to grow. I have no idea how much more adoption premium is harvestable in this space. Collectibles offer good long-term returns with additional social benefits such as being the only truly green investment in the store of value asset class. Any combination of the above may be of interest to investors.

Collectibles and art have historically returned 2-3% after inflation with little correlation with stocks and bonds. That’s very attractive in the current environment. Investing in collectibles is not for everyone. The process takes a lot of time and hold times must be a decade or longer. You’ll likely need to become a quasi-expert in the field and building the collectible portfolio can take years of patient buying. While most investors should avoid the asset class, there are multiple valid approaches to investing in collectibles, art, and other rarities.

      1. If you’re super passionate about a particular collectible, or you’re already a savvy collector, then I believe now is the right time to splurge on some of those high-end items you’ve always coveted. Another thought is to enter the field as a new career or entrepreneur.
      2. If you’re seeking to make a name in a particular field and you have the financial resources to bid on the very best rarities, then now may be the time to jump into the arena.
      3. If you’re a high-net-worth investor seeking to diversify out of bonds into more productive assets, then collectibles might be worth a small portion of a very diversified portfolio with the intention to hold for at least a decade or longer. Minimizing implementation costs will be key.
      4. If you’re a go anywhere asset class trader, then collectibles may be an interesting long-term investment to be held in the store-of-value bucket. Again, implementation is key, and the expectation is to hold for at least a decade. In addition, many asset class trading edges can be utilized to further enhance returns. One trading edge is to act like a dealer or market maker to provide liquidity and take advantage of the large spreads. Being ready to sell into parabolic price increases, and buy into panic selloffs, is another edge. Asset class traders can also exploit stale pricing to enter or exit the collectibles space during or after a major equity bear market. Finding undervalued collectibles may enhance returns. And of course, allocating capital to more conventional asset classes when there are few opportunities in the collectible space makes sense.

Transaction costs can be minimized by being agnostic about what collectible is purchased. Submit limit orders for many potential buys. Try to bid at a price below the mid-point of the current spread with auctions. Negotiate better prices with dealers. Buy when prices are sinking, and other collectors want out. Buy when no one is interested. Avoid chasing prices higher except in rare cases. Have the conviction to buy when prices are falling. Keep the allocation to collectibles small enough so you never have to sell.

Seek collectibles that appear to be trading below intrinsic value. Crypto prices have grown exponentially over the past ten years. NFTs have spiked by multiples over the past year.1 Trading card prices have spiked during the pandemic as indicated by the various indexes published by Card Ladder. Waiting for a good correction in the above markets may be warranted before investing. Perhaps hold gold while you wait, since gold prices have languished since peaking in August of 2020.

Older and more established collectibles are just starting to increase in value. Stamps and art peaked in 2008 and may be worth a look now. U.S. rare coins look particularly interesting and a good value. Prices of mid-tier rare coins peaked in 1989 at extreme valuations during the slabbed-coin bubble. Now, after falling versus inflation for the past 30 years, prices are starting to perk up. U.S. rare coins have many advantages over other collectibles. The dealer and auction market are the most active among all collectibles. Rare coins can be readily sold at any time. Pricing data for all coins go back to the 1950s, with extensive data going back to 1970. All investable coins have already been slabbed, so population counts are comprehensive. Coins are very storable, with minimal carry costs. Of course, a detailed understanding of the history of pricing and grading is essential for doing well in this asset class.


References

  1. Murphy, H. and Oliver, J., “How NFTs became a $40bn market in 2021, Financial Times, December 30, 2021.
  2. Tilley, D., “Two Unappreciated Compelling Reasons to Own Gold in the 2020s”, Asset Class Trading Blog, March 12, 2020.
  3. The Art Basel and UBS Global Art Market Report 2021. Using a flow approach of $50 billion in annual sales along with an estimate of a roughly 20-year average holding period, yields a market cap of about $1 trillion.
  4. Heitner, D., “Playing Ball in the Multi-Billion Dollar Sports Collectible Market, Forbes, April 11, 2016.
  5. Elbaor, C., “Buyers of Maurizio Cattelan’s $120,000 Banana Defend the Work as ‘the Unicorn of the Art World,’ Comparing it to Warhol’s Soup Cans, Art World, December 10, 2019.
  6. Dimson, E. and Spaenjers, C., “Ex Post: The investment performance of collectible stamps”, J. of Financial Economics, 2011, vol. 100, issue 2, 443-458.
  7. Dimson, E. and Spaenjers, C., “The Investment Performance of Art and other Collectibles”, Chapter 10 of the book: Risk and Uncertainty in the Art World, edited by Anna M. Dempster, 2014.
  8. Dimson, E., Marsh, P., Staunton, M., Credit Suisse Global Investment Returns Yearbook 2018.
  9. Goetzmann, W., Renneboog, L., Spaenjers, C., “Art and Money”, American Economic Review, Vol. 101, No. 3, May 2011, pp. 222-26 plus various working papers.
  10. Artprice Quarterly Global Art Market Index, data can be obtained here: https://imgpublic.artprice.com/pdf/agi.xls?ts=2020-11-17 10:19:15
  11. Chernow, R., “The House of Morgan: An American Banking Dynasty and the Rise of Modern Finance, 2010.
  12. Scheidel, W., “The Great Leveler: Violence and the History of Inequality from the Stone Age to the Twenty-First Century, 2018.
  13. Robert A. Siegal Auction Archives, The William H. Gross Collection, Sale #1188, #1200, #1211, and #1228, 2018-2020.


Disclosure

Past Performance is not indicative of future results. The content contained within this blog reflects the personal views and opinions of Dennis Tilley, and not necessarily those of Merriman Wealth Management, LLC. This website is for educational and/or entertainment purposes only. Use this information at your own risk, and the content should not be considered legal, tax or investment advice. The reader should consult with a financial services professional regarding the suitability of collectibles in their own investment portfolio.

The views contained in this blog may change at any time without notice, and may be inappropriate for an individual’s investment portfolio. There is no guarantee that securities and/or the techniques mentioned in this blog will make money or enhance risk-adjusted returns. The information contained in this blog may use views, estimates, assumptions, facts and information from other sources that are believed to be accurate and reliable as of the date of each blog entry. The content provided within this blog is the property of Dennis Tilley and Merriman Wealth Management, LLC (“Merriman”). For more details, see the Important Disclosure.     

Interview with Dennis Tilley

Interview with Dennis Tilley


I was recently interviewed by Technical Analysis of Stocks and Commodities, and my interview was published in the July 2021 issue.

The past 18 months have been a heartbreaking period of human angst and suffering as the COVID-19 pandemic came out of nowhere to wreak havoc on the world’s economy, expose rifts, and accelerate all sorts of technology trends. For an asset class trader, the period was rich with opportunities. My focus during this time has been on portfolio management and applying all I have learned during the past 25 years to navigate this unprecedented period in the markets.

I hope to get back to writing and reflecting about what works in asset class trading in the near future. As always, published blog posts are intended to be timeless in nature, so new readers should not hesitate to read articles written years ago.

Two Unappreciated Compelling Reasons to Own Gold in the 2020s

Two Unappreciated Compelling Reasons to Own Gold in the 2020s

Executive Summary

There are many smart investors who’ve taken a shining to gold in recent years. Their reasons are many, including negative real interest rates around the world, central bank buying, and rapidly rising production costs. In addition, gold can provide insurance for all sorts of nasty financial outcomes that appear quite possible due to excessively high debt-to-GDP levels and high wealth inequality. Such outcomes and worries include the rise of populism, money printing, trade wars, competitive devaluations, unconventional monetary policies, an unexpected rise of inflation and the vulnerability of the U.S. dollar to a significant decline. Even a run-of-the-mill recession may trigger significant pain and uncertainty for the markets.

In this post, I discuss two unappreciated and compelling reasons to own gold that go beyond what is mentioned above. The first is that gold is significantly under-owned among U.S. investors. Many investors think they’re covered by owning a few gold coins in a safe deposit box. This is not enough gold exposure. I compare U.S. gold ownership with stocks, bonds, and real estate going back to 1900. These charts show that gold ownership is near historic lows, while central bank quantitative easing has bid up financial assets to all-time highs as a percentage of GDP.

Second, using mean-variance portfolio mathematics, one can show that replacing a small portion of government bonds with gold will enhance future portfolio risk-adjusted returns if real interest rates stay below 0% and gold returns simply match inflation. These assumptions are realistic considering that holding rates below inflation is the least painful way central banks can slowly reduce debt levels over time.

In the past decade, investors have combated low bond yields by replacing bonds with liquid alternatives, hedge funds, managed futures funds, and commodity funds. During this time, alternatives have over-promised and under-delivered, barely beating T-bill returns, net of fees. If real T-bill yields remain negative over the next decade, expect alternatives to continue to disappoint. Increasing an allocation to gold from liquid alts may also make sense.

By selling a portion of bonds or alternatives, and placing the proceeds into gold, we can enhance future portfolio risk-adjusted returns while also owning financial chaos insurance. Such an allocation can also provide insurance for a scenario when stocks and bonds get hammered at the same time, which is a weakness of the standard 60:40 portfolio. A small allocation to gold belongs in today’s modern investment portfolios.


Introduction

Figure 1 below shows the history of gold prices over the past twenty years along with the U.S. Dollar Index. Gold’s previous large-scale rally saw its price rise from $250 per troy ounce in 2001 to a peak of $1900 in September 2011. At the time, the European debt crisis was raging and central banks around the world were deep into their quantitative easing programs. Many of the reasons to be bullish on gold in 2011 are still around today, yet gold peaked then and fell over the next four years to a low of $1050 per troy ounce in December 2015. It’s hard to nail down exactly why gold peaked in 2011, but perhaps the market priced in all the bullish reasons to be long gold at the time. Another contributing factor is that the U.S. dollar bottomed in 2011.


Figure 1: History of gold prices from December 31, 1999 to December 31, 2019.


In June 2019, gold broke out of a five-year consolidation pattern as the German 10-year yield fell deeper into negative territory and 30% of the world’s bonds had negative interest rates. At the end of 2019, gold sat at $1517 per troy ounce. Table 1 shows the total returns of various asset classes since gold peaked in 2011. Compared to all in the table, gold has lost purchasing power since its high point. Compared to the U.S. inflation index, gold lost 17.5% of its purchasing power over that time frame, while gold underperformed U.S. stocks by almost 250%.


Table 1. Asset class performance since gold peaked in 2011.

The two U.S. Dollar indices also gained versus gold in the past eight years. As the world’s reserve currency, the U.S. dollar has a strong inverse effect on gold prices. The previous peak in the U.S. dollar in 2001 coincided with the start of the previous gold bull market.

Over the past couple of years, a few smart billionaire investors have promoted gold in this environment. I’ll briefly review their reasons below.


The Six Well-Known Reasons to Own Gold


Reason 1: Excessive Debt Levels around the World

Ray Dalio, the founder of Bridgewater Associates, has written a must-read study1 of secular debt bubbles and the various government policy approaches used to reduce debt levels over time. As shown in Figure 2, the total amount of debt issued in the United States is around 350% of GDP. This debt consists of federal and state government debt, mortgage-backed debt, corporate debt, consumer debt, student loans, auto loans, private bank loans, and more. The U.S. is not alone. Practically all countries have excessively high debt-to-GDP levels, in the 300% to 800% range. Once interest rates peaked in 1981, debt issuance grew steadily over the decades, reaching a high in 2008 for most countries.


Figure 2. United States debt as a percentage of GDP.

Copyright 2019 Ned Davis Research, Inc. Further distribution prohibited without prior permission. All Rights Reserved. See NDR Disclaimer at https://www.ndr.com/terms-of-service#disclaimer.


Why did debt grow to such high levels? Simply put, once interest rates peaked in 1981, debt has worked. It’s been a perfect environment to use debt. Since 1981, we’ve had only 3 recessions in 38 years – about one every ten years. During these recessions, central bankers had tons of room to reduce interest rates to “new lows” to rescue debtors by supporting asset pricing and improving debt-service costs. An environment of falling interest rates, rising collateral values and contained inflation is the only world most investors know.

Since 2008, when the secular debt bubble peaked, the U.S. (and the world) is working on what Ray Dalio calls a “beautiful deleveraging” process to slowly reduce debt levels. This process requires a careful balance of many levers to avoid pushing world economies into recession, and fairly spread the pain among constituents and over time. Central bankers have learned from past mistakes and, so far, the pain has been minimized.

All policies to reduce debt are supportive of gold long term. Financial repression, the preferred approach, keeps interest rates below inflation, helping slowly reduce debt-to-GDP over time by promoting economic growth, supporting collateral prices, weakening the currency, and keeping debt-service costs low. Financial repression is fully within the realm of central bank powers and is highly favored versus other options during quiescent economic times. Unfortunately, savers experience the pain of inflation slowly eroding their purchasing power.

In a crisis, or during a recession, more aggressive policies are required. First up is quantitative easing, used to inflate financial asset values, promote a wealth effect, and spur economic growth. Next up is money printing and debt defaults (in the private space). Please read Dalio’s free book titled “Principles for Navigating Big Debt Crises.”1 All these polices are favorable to gold.


Reason 2: The Rise of Populism

Dalio also published a study2 investigating the rise of populism and the policies associated with populist governments. Populism arises out of economic stagnation, wealth inequality, and political paralysis, all of which are trending higher in the world and the U.S. This year’s presidential election is certainly witness to that. Populists typically implement policies such as trade wars, currency devaluations, attacking corporations and foreigners, and starting wars. These policies create a lot of economic uncertainty and are supportive of gold prices. Donald Trump is a populist president from the right, and may soon be running against a left-wing populist in the upcoming presidential election.


Reason 3: Central banks are buying

Another well-known reason to own gold is that central banks have shifted from net sellers to net buyers of gold. This trend started after the Great Financial Crisis in 2009, with the largest purchasers being China and Russia. An excellent source of gold information used throughout this blog post, including central bank holdings, is the World Gold Council website.3


Reason 4: Lack of New Supply and Rapidly Rising Mining Costs

Billionaire real estate investor Sam Zell purchased gold for the first time in his career in 2018-2019. While attracted to the crisis-mitigation properties of gold, his reasoning was more of a boots-on-the-ground fundamental argument. He sees that production growth is slowing, mining costs have grown considerably, and there’s very little capital going into new production. The performance of gold mining stocks has been abysmal over the past decade, in part because the all-in costs of producing an ounce of gold has grown much faster than inflation. A recent McKinsey report on the industry highlighted the struggles of shrinking reserves and rising costs.4


Reason 5: Negative Real and Nominal Interest Rates

Interest rates are negative throughout much of Europe and Japan. The fraction of the world’s bonds trading at negative yields leaped to 30% in the third quarter to 2019, which was profoundly inconceivable before the Great Financial Crisis. Negative interest rates is essentially a new experimental monetary policy that has never been seen in the history of mankind, and central banks are in no hurry to raise interest rates. The U.S. central bank attempted to reverse this trend in 2016 by raising short-term rates up to 2.25%. This attempt to “normalize” interest rates turned out to be premature, as world economic growth quickly cooled because of an apparent intense sensitivity to interest rates.

U.S. TIPS are pricing in the negative real rates going out 15-20 years; and the coronavirus scare has caused the ten-year TIPS yield to fall to -40 bps. The market is pricing in at least ten years of negative real rates, yet gold seems to be priced as if rates will normalize during that time.


Reason 6: The U.S. Dollar is Vulnerable and Overvalued

The sixth and final well-known reason to be long gold is that U.S. government debt is getting close to breaching 100% of GDP with no signs of slowing. Currently, the U.S. government spends over a trillion dollars more than it takes in with taxes, which increases debt/GDP by 4-5% per year. Politicians on both sides seem uninterested in reducing debt levels. Figure 3 shows the level of U.S. government debt since the inception of our nation, as well as a projection of the future by the Congressional Budget Office.

Figure 3. History of U.S. Government Debt as a percentage of GDP.5


The last time U.S. debt-to-GDP broke 100% was after WWII. The U.S. central bank capped interest rates at around 2% up to 1951 while nominal GDP grew by 70% and inflation was 6.5% per year. That’s why debt-to-GDP fell so rapidly during the post-war period. World economies were also poised for massive growth following two decades of wars and the Great Depression.

Normally when the economy is booming, we expect the budget deficit to narrow, or perhaps turn positive. If the U.S. economy eventually falls into its next recession, tax revenue will collapse, and the budget deficit will balloon. Gold is an excellent hedge for this scenario, especially if investors begin to worry about the government’s printing press option.

Strong flows into U.S. dollar assets, chasing higher bond yields and higher equity returns, have no doubt supported U.S. asset prices and the dollar. In addition, the U.S. Dollar appears to be overvalued versus most currencies based on purchase-power-parity and the Economist Magazine’s Big-Mac index.

The U.S. economic dominance theme will eventually end, and when it does, I expect investors inside and outside the U.S. to be selling dollars to invest elsewhere in the world. Ultimately, these reasons suggest the dollar is highly vulnerable to a secular decline in the future, which will be very positive for gold.

To summarize, here are the well-known reasons smart investors are adding gold to their investment portfolios:

  1. Excessive Debt Levels around the World
  2. The Rise of Populism
  3. Central Banks are Buying
  4. Lack of New Supply and Rapidly Rising Mining Costs
  5. Negative Real and Nominal Interest Rates
  6. The U.S. Dollar is Vulnerable and Overvalued

Those in the precious metals business, a.k.a. the gold bugs, have of course highlighted the above justifications for holding gold. But their views must be taken with a grain of salt because they are always bullish on gold. When great investors like Ray Dalio and Sam Zell become attracted to gold, that’s a different story.

None of the reasons to be long gold listed above are new. Gold prices may have already incorporated this well-known information. Perhaps, investors have already looked ahead, and bid up gold prices in anticipation of these outcomes. For instance, gold may have a “sell-the-news” reaction if Bernie Sanders wins the election in November 2020.

There are two additional arguments for holding gold that investors may not realize, and for that reason I think they’ve not been fully incorporated into gold prices. First, gold is extremely under-owned among U.S. investors. Second, adding gold to a diversified portfolio can enhance risk-adjusted returns even if the inflation rate never accelerates beyond 2%. It’s as if the inflation/financial chaos insurance provided by gold is being provided at no cost.


Argument 1: Gold is Extremely Under-Owned by U.S. Investors

I remember reading Money Magazine in the early 1990s when I began investing. At the time, the conventional asset allocation advice for individual investors seemed to have a 5-10% allocation to gold or gold mining stocks. No longer; few pension funds or investment advisor portfolios have an allocation to gold.

I’ve spent considerable time developing measures of market capitalization of various asset classes since 1900. Most of this data can be found at the St. Louis Federal Reserve Economic Data (FRED) website. But I’ve also used data from other sources to fill the gaps and make estimates for earlier time periods.3,6-12 One book that’s interesting on this subject is Raymond Goldsmith’s “Comparative National Balance Sheets – A Study of Twenty Countries, 1688-1978,” which was published in 1985. From the data associated with these references, and some interpolation, I developed an estimate of how national wealth was distributed over time compared to U.S. GDP.

Figure 4 shows the market capitalization of U.S. stocks as a percentage of GDP. Stocks have been huge winners since the secular bottom in the early 1980s, and now sit at a market capitalization close to the internet bubble peak of 2000. Stocks appear expensive by many other measures, yet it’s possible that this pricing is rational considering very low interest rates, the potential for quantitative easing at any sign of economic weakness, and booming technology stock profits.

It’s interesting that most of the developed world’s stock markets (ex-U.S.) sit in a range of 30-70% of GDP, which is aligned with most U.S. history before the late 1990s. The previous U.S. stock market bubbles peaked at about 86% of GDP in August 1929 (ending 1929 at about 60%) and 168% of GDP in March 2000 (ending 1999 at 155%). The Japanese stock market bubble peaked at 139% of GDP in 1989 and the Chinese stock bubble peaked at about 80% of GDP in 2007.


Figure 4. U.S. Stock Market Capitalization as a percentage of GDP (as of December 31, 2019).


Figure 5 shows total debt-to-GDP for the nation since 1900. Since debt is both a liability for one, and an asset for another, Figure 5 provides a measure of the total “bond market” capitalization as a percentage of GDP. As discussed above, this measure includes U.S. government debt such as T-bills, bonds and TIPS. It consists of real estate mortgage-backed debt, state and municipal debt, as well as loans, corporate debt and more.


Figure 5. Bond and Loan Market Capitalization as a percentage of GDP (as of December 31, 2019).


Figure 6 shows residential real estate as a percentage of GDP. Typically, home prices rise with inflation over time, while the total housing stock rises with the sum of population growth and inflation, or essentially rises with GDP. Since around 1980, the residential real estate market cap has outpaced GDP, which is explained by rising land values rather than rising building costs or rapid home building.13 There’s no doubt that home price appreciation, especially on the two coasts, is supported by record-low mortgage rates, booming tech company profits, and growing wealth.

Prior to 1952, I used pointwise estimates from Goldsmith for the years of 1900, 1929, and 1945, and interpolated between these data points using population growth data and the Shiller home price index. It’s interesting that during the Great Depression, home prices fell 21% from 1929 to 1932, but not as much as nominal GDP, which fell by 46% over the same time period.

Unfortunately, I have no data for the value of commercial real estate over time. A recent estimate put it at $16 trillion at the end of 2018, compared to a $28 trillion market value for residential real estate at the time. According to Goldsmith, the value of commercial real estate was roughly the same magnitude of residential real estate over the past century.


Figure 6. Residential Real Estate as a percentage of GDP (as of December 31, 2019).


Finally, Figure 7 shows the estimated value of U.S. gold ownership over time since 1900, including U.S. central bank gold. The amount of world gold since 1900 is known reasonably well since gold production has been monitored for centuries, and essentially all gold mined is stored above ground in the form of gold bars, jewelry, and coins. There are currently about 193,000 metric tons (MT) of above-ground gold, with new supply at around 3,500 MT per year.3 Back in 1900, that figure was 28,000 MT, with new supply growing at 400 MT per year.8

As of Dec 31, 2019, the total market value of the world’s gold supply is $9.4 trillion, which dominates the market value associated with other tangible stores of value. Mixed-use industrial/monetary metals such as silver and platinum have above-ground value estimates of $50 billion and $7 billion respectively. These metals are also sensitive to economic activity, and thus have a positive correlation to equities.

Collectibles and art can also serve as stores of value, although highly-valued rarities are very sensitive to global wealth. It’s difficult to nail down a market cap for these murky markets, but it’s probably less than $1 trillion. While not tangible, bitcoin is sort of an electronic version of gold; it had a market value of $131 billion at the end of 2019.

It’s estimated that 50% of gold is in the form of jewelry, 20% in privately held coins and bars, 17% held in central bank reserves, and 13% tied up in industrial uses.4 The majority of jewelry ownership is in India and China.

Since gold is fundamentally untraceable, estimating the amount of gold in U.S. hands (government, industrial and public) requires a few assumptions to estimate ownership throughout time. For instance, in 1933 the U.S. government required private investors to turn in their gold bullion, which swelled central bank holdings. One rough approximation for the percentage of gold owned by U.S. entities is to take the U.S. GDP weight of the world’s gold supply. I’ve attempted to refine this estimate using the information in available references.3,6,7

At the end of 2019, I estimate a total U.S. ownership of 40,000 MT, or about 20% of the world’s total. We know that 8,133 MT is held by the U.S. central bank, and 1,250 mt is held in U.S. gold bullion ETFs.3 Using the above percentages, roughly 20,000 MT is held in jewelry form, 5,000 MT is tied up in industrial uses, leaving about 5,600 MT held privately in safe deposit boxes and banks in the form of coins and bars.

I’d guess that the jewelry estimate of 20,000 MT is high, while that held in bullion form is low. Still, in the U.S. over the last ten years, 600 MT of gold production went into bullion form compared to 1,200 MT for jewelry.3 Using this ratio, conceivably as much as 8,000 MT is privately held in gold coin and bar.


Figure 7. U.S.-held gold as a percentage of GDP (as of December 31, 2019).


Putting it all together, Figure 8 shows the fraction of wealth in gold versus the combined total of gold, stocks, bonds, and residential real estate. While not at the all-time lows associated with 1970 or 2000, gold ownership remains very low compared to financial asset values. Financial assets ballooned since 1981 as interest rates fell from 15% to 1%; and as shown in Table 1, financial asset growth has been strong since gold peaked in 2011. Financial assets are very over-owned compared to physical store-of-value assets.


Figure 8. U.S.-held gold market value as a fraction of the total market value of U.S. stocks, bonds, homes and gold.


As a check on the idea that U.S. institutional and private investors are heavily underweight gold, we can look at a few back-of-the-envelope checks. First, gold bullion ETFs make up only 0.25% of U.S. ETF and mutual fund assets. Adding in the 8,000 MT of gold held privately can bump this percentage up to 1.85%, but this ignores the stocks, real estate, bonds, and loans not held in mutual funds or ETFs. It’s safe to say that gold held by investors as a fraction of all U.S. financial assets is about 1% or less.

As a second check, we notice that over the past 10 years, only 5% of new gold supply in the form of jewelry, bars and coins has flowed into the U.S., with the majority going to India and China.3 In comparison to the U.S. making up 24% of world’s GDP, U.S. equities making up 58% of the MSCI All Country World Index (ACWI), and U.S. bonds making up 44% of the world’s publicly traded bond markets, we see that gold as a percentage of U.S. financial assets has been falling over the past decade.

The bottom line is that U.S. investors are massively underweight the premier tangible store-of-value asset compared to historical ownership rates over the past 120 years. The above case also supports other stores of value including bitcoin, silver, platinum, and possibly mid-priced collectibles.

Some may argue that a house is also a tangible store of value. While there are similarities, homes have significantly higher carrying costs (property taxes and upkeep) compared to gold. Residential real estate has also become more financial-like as homes are now held with debt financing and land values on the east and west coasts have risen in tandem with financial assets. When land values become a much larger portion of home prices, we expect home values to fluctuate more with the economy and wealth. A cheap house owned without debt in middle-America is the home most like a store of value asset.


Argument 2: Gold can Enhance Risk-Adjusted Returns while Providing Crisis Insurance

U.S. government bonds have long served as the safety asset class in modern portfolios. Since the Fed controls the printing press, there is no default risk associated with T-bills, T-Bonds, TIPS, and GNMAs. We expect these securities to dampen portfolio volatility and cushion equity bear markets and recessions by going up in value when stocks crash. In addition, as we extend maturities beyond T-bills, we expect a long-term annualized return premium above inflation that’s on the order of 1-2% per year.

For gold, history shows that annualized returns match inflation over the long-term, while volatility has been similar to equities since gold began to float versus the dollar in the early 1970s. Also, gold returns are fundamentally uncorrelated with stock and bond returns. Figure 9 shows how adding 10% gold (from bonds) affects portfolio expected returns in the nominal case. Each dot represents a 10% equity allocation increment from 0% to 100% as we increase portfolio risk. I’ve used three ETFs for this illustration, with all return assumptions in the box below the curve, including an assumption that the inflation rate is 2% per year. The return and standard deviation information included is for illustrative purposes only and does not represent actual performance results.

Adding gold reduces risk-adjusted returns except at very low equity-bond splits. One way to view the reduction of returns per unit of risk is that this is the cost of unexpected inflation/financial catastrophe insurance that gold provides.

Figure 9: The hypothetical impact of adding 10% gold (from bonds) to portfolios of various equity-bond splits in a normal investing environment.*


What’s different now? Future government bond returns will be a far cry from those associated with the last 40 years. TIPS breakeven yields suggest flat to negative real interest rates out to 20 years. Economies around the world are highly sensitive to higher interest rates. As soon as rates rise, economic growth slows, thus sowing the seeds for future rate declines. In addition, central banks are highly motivated to keep interest rates below the inflation rate to help reduce debt levels over time.

What are the portfolio implications? First, over the next decade, we expect government bonds to provide future returns that are below inflation rates on the short end, and matching inflation on the long end. Figure 10 shows this case simply by changing the bond return assumption to match inflation before fees. We continue to assume that gold will provide inflation-matching returns. Adding a 10% allocation to gold now enhances portfolio risk-adjusted returns even though the bond ETF slightly outperforms the gold ETF net of fees.

Adding gold, and the insurance it provides, no longer penalizes portfolio risk-adjusted returns. Gold ETFs provide an excellent way to gain exposure at low fees (18 bps), no storage or insurance costs, and ownership in tax-deferred accounts to avoid the collectibles tax rate.

In addition to enhancing risk-adjusted returns, gold provides solid insurance for many tail-risk scenarios, including an unexpected inflation spike, currency and trade wars, political chaos and hot wars, increased corporate tax rates, recessions risk, default risk, negative interest rates, and money printing. With debt-to-GDP levels and wealth inequality so high, this insurance seems needed more than ever.


 Figure 10: The hypothetical impact of adding 10% gold (from bonds) to portfolios of various equity-bond splits with the assumption that bonds deliver returns that match inflation.*


Another potential source of funding for a gold allocation is from the alternatives camp. This class of investment strategies include hedge funds, liquid alternatives funds, managed futures, and commodity funds. These alternatives have a number of issues that have led to generally poor performance over the past 10+ years.14,15

In an environment of financial repression, expect alternatives to struggle for a few reasons. First, the returns associated with these strategies are fundamentally linked to T-bill returns, which are often used as collateral for much of the portfolio. If short rates are held below inflation over the next decade, expect gold to perform well comparatively.

Second, these strategies have high fees and are generally crowded with too much assets. This leads to poor aggregate returns for everyone. For those strategies fundamentally uncorrelated with stocks and bonds, like commodity and managed-futures funds, expect returns to be close to T-bills minus fees. For strategies that have some correlation with equities and credit (most hedge funds), expect diminished portfolio diversification benefits. In other words, replacing bonds with hedge funds will provide a similar risk-adjusted return as simply raising equity exposure slightly. Another issue is what kind of losses will we see during the next financial crisis? Will hedge funds repeat their 6-sigma epic fail when stocks crashed in 2008-2009?

Of course, if you can find the outperforming alternatives and hedge funds, then there’s plenty of benefit for the portfolio. Even so, it’s worth considering a partial shift of the alternative’s allocation into gold.


Additional Thoughts as a Trader

Gold appears to deserve a much larger allocation to pension fund and individual investor portfolios. We don’t need inflation to rise above 2% for this allocation to work.

Investors need to shake their views that gold is only useful as an end-of-the-world anarchy hedge satisfied by gold coins in a safe deposit box. Gold deserves a role in modern portfolios with a position size that will make a difference. A 5% allocation makes sense.

I expect investors to be very slow to incorporate this view. Professional investors, either investment advisors or pension fund managers, have little interest in gold for most likely irrational reasons – it’s an unconventional view, inflation remains subdued, there’s little client interest, career risk mitigation, or perhaps from being burned by the last time they recommended gold to clients a decade ago.

Figure 11 shows a hypothetical case where equity returns are reduced (in-line with many expert opinions) and gold providing equity-like returns, assuming gold is repriced to higher values as more and more investors adopt a gold allocation in their portfolio. Adding gold with this upside scenario is very attractive.


Figure 11: The hypothetical impact of adding 10% gold (from bonds) to portfolios of various equity-bond splits under the assumption that gold provides equity-like returns.*


Lastly, we notice that gold is acting very well right now. Gold is moving up and down with treasuries, which are moving inversely with equities. When equities fall, due to poor economic news or recently due to the coronavirus outbreak, treasuries and gold go up in value. On positive economic news, equities rise in value, while bonds and gold sell off. Gold has been basing for 8 years, while U.S. financial assets have been the star performers.

In addition, gold is providing an excellent long-term tell. As the dollar has continued to rise during the past year, gold has also experienced a strong uptrend, even in the face of strong equity returns over the past year. This is not supposed to happen, and this sort of tell is a good sign for future rising prices.


Conclusions

I write this blog post as an asset allocator and investor. I’m not a “gold bug” and I’m not predicting any sort of world catastrophe. I don’t think we should go back to the gold standard; indeed, I think floating currencies have played a role in making markets and economies safer over the past 50 years.

My general view is that gold does not belong in a long-term investment portfolio because historically returns have just matched inflation. We want only inflation-beating asset classes in our portfolios. This is the conventional view of most investment professionals, and for that reason, gold is significantly under-owned.

Yet now, gold makes sense with bond yields so low. It seems very reasonable to bet that interest rates will remain below inflation over the next decade. Gold is breaking out of a 8-year consolidation period. It’s acting very strong while the U.S. dollar and stock market has risen over the past year.

Black swan risks seem heightened and it’s been ten years since the last recession. The opportunity cost associated with owning gold, rebalancing periodically to dampen the volatility, appear to be very low, perhaps even negative. Bitcoin, platinum, silver, and collectibles may also make sense at this time, but gold remains the most liquid and premier store-of-value asset. Gold deserves an allocation in modern investment portfolios. 


References

  1. Dalio, R., Principles for Navigating Big Debt Crises, November 2018.
  2. Dalio, R., “Populism: The Phenomenon”, Bridgewater Daily Note, March 22, 2017.
  3. World Gold Council, https://www.gold.org/.
  4. Callaway, G. and Ramsbottom, O., “Can the gold industry return to the golden age: Digging for a solution to the gold mining reserve crisis”, McKinsey & Company, April 2019.
  5. Congressional Budget Office Report, “The Budget and Economic Outlook: 2020 to 2030, January 28, 2020. https://www.cbo.gov/publication/56020.
  6. Goldsmith, R., Comparative National Balance Sheets – A Study of Twenty Countries, 1688-1978, 1985.
  7. Green, T., “Central Bank Gold Reserves: An historical perspective since 1845, World Gold Council Research Study No. 23, November 1999.
  8. S. Geological Society National Minerals Information Center, https://www.usgs.gov/centers/nmic.
  9. The World Bank, https://data.worldbank.org/.
  10. Our World in Data, https://ourworldindata.org/.
  11. Ned Davis Research, https://www.ndr.com/.
  12. Vague, R., “The Private Debt Crisis”, Fall 2016, https://democracyjournal.org/magazine/42/the-private-debt-crisis/.
  13. Knoll, K., Schularick, M., Steger, T., “No Price Like Home: Global House Prices, 1870-2012”, Federal Reserve Bank of Dallas, Working Paper No. 208, October 2014.
  14. Tilley, D.L., “Asset Class of Trading Strategy?”, Asset Class Trading, July 13, 2015.
  15. Tilley, D.L., “Why we still don’t favor commodities”, February 14, 2008. https://www.merriman.com/advanced-portfolio-management/why-we-still-dont-favor-commodities/.

Disclosure

*The return and standard deviation information included in Figures 9, 10, and 11 is for illustrative purposes only and does not represent actual performance information.

Past performance shown in other figures and tables (such as Table 1 and Figure 1) is not indicative of future results. The content contained within this blog reflects the personal views and opinions of Dennis Tilley, and not necessarily those of Merriman Wealth Management, LLC. This website is for educational and/or entertainment purposes only. Use this information at your own risk, and the content should not be considered legal, tax or investment advice. The reader should consult with a financial services professional regarding the suitability of gold in their own investment portfolio

The views contained in this blog may change at any time without notice, and may be inappropriate for an individual’s investment portfolio. There is no guarantee that securities and/or the techniques mentioned in this blog will make money or enhance risk-adjusted returns. The information contained in this blog may use views, estimates, assumptions, facts and information from other sources that are believed to be accurate and reliable as of the date of each blog entry. The content provided within this blog is the property of Dennis Tilley & Merriman Wealth Management, LLC (“Merriman”). For more details, see the Important Disclosure.  

Asset-Class Value Traps and Catalysts to Avoid Them

Asset-Class Value Traps and Catalysts to Avoid Them

Executive Summary

In the last of our asset-class valuation series, I discuss costly value traps that can derail even the best-reasoned asset-class value themes. A lot can go wrong when you bet on value. In particular, an asset class that appears to be an excellent value can stay that way for years. 

All investors face this problem and most professional investors who manage billions of dollars have only one option, which is to leg into these investments over time. Asset class traders have the benefit of being small enough to wait for a catalyst before trading a compelling value opportunity. In this blog post, I review various catalysts I use to get the timing right and avoid the value traps.

Introduction

Most traders and investors know to be aware of value traps when investing in cheap assets. Value investors comment that risk of permanent loss is the true risk associated with investing, and a worst-case scenario is losing 100% of capital. Although asset classes rarely lose 100% of their value, value traps in the asset class arena are not much different. 

My main concern when using the “compelling valuation” trading edge to overweight an asset class is that it underperforms an equity benchmark. In other words, if I own Korean stocks because I feel they’re irrationally cheap, and they underperform my benchmark during the hold period, then the trade didn’t work. Either I didn’t assess the situation correctly, or the timing wasn’t right, or perhaps fundamentals changed the assessment over time. The opportunity cost associated with this mistake is what hurts the most.
(more…)

Compelling Value

Compelling Value

Executive Summary

  • Asset classes trading significantly below intrinsic value occur infrequently, perhaps once every 10-20 years per asset class. We need to accept that asset pricing (for long hold periods) is rational and correct most the time, and that cheap asset classes are usually cheap for a reason.
  • I discuss methods I use to determine when an asset class is irrationally mispriced well below long-term intrinsic value. I’m trying to distinguish a once-a-decade compelling valuation versus run-of-the-mill everyday value opportunities. Compelling values set up lucrative multi-year trades to the long side.
  • While there’s no formula for identifying these opportunities, I present three steps I take in the search. First, I find prices that appear to be an extreme outlier with respect to history, logic and other asset class valuations. Second, I identify the behavioral effect causing the asset class to be mispriced compared to long-term intrinsic value. Finally, I ask myself a few common-sense questions, such as: If I was designing a portfolio to hold for the next 10 years, would I substantially overweight this asset class?
  • A compelling value is a trading edge that’s long-term in nature, so an asset class can stay that way for years. Since it’s unknown when (or if) the market will recognize a compelling value, an asset class trader ultimately requires a timing catalyst to initiate the trade. Getting the timing basically right – for a move that can take years to unfold – is an important edge for the asset class trader compared to value investors and asset allocators.

Introduction

Value investors typically hold cheap securities based on an analysis of future growth prospects and many valuation measures. They sell assets that rise in price (and hit price targets) and replenish the portfolio with cheaper assets that have recently suffered price drops. They manage the portfolio with a low turnover, typically 25% per year or lower. Many securities purchased may be underpriced due to irrational overreactions to bad news, but most are likely cheap for a reason – they are riskier or have inferior growth rates. This is particularly true for the value screens used by index-based value ETFs.

Contrary to adopting the value investor philosophy, as an asset class trader, I’m only interested in using the value approach when there’s a compelling opportunity. A compelling value at the asset class level is created by irrational human behaviors working on very long time scales to drive a price well below intrinsic value. Examples of such behaviors include long-term investor herding, industry-wide groupthink, gun-shy investors fearing a repeat of severe losses, and bubbles.

Sorting out what’s cheap and expensive among various asset classes is inherently difficult because asset classes have vastly different risk and return characteristics. It’s hard to compare Russian stocks with U.S. stocks because there are significant non-quantifiable risk differences. How can we estimate when growth stocks are underpriced? When do high-yield bonds have a better risk-adjusted expected return than equities? These questions are impossible to answer definitively.

Despite the difficulties, an educated guess that an asset class is undervalued, combined with a catalyst, can be a huge source of outperformance. In this blog post, I attempt to distinguish a once-a-decade compelling valuation created by long-term, irrational human logic and the “good values” we read about in research reports every day. (more…)

Shiller CAPE – A Deceptively Dangerous Tool

Shiller CAPE – A Deceptively Dangerous Tool

Executive Summary

In this post, I examine the popular stock market valuation tool, the Shiller CAPE. The Shiller CAPE valuation approach, based on 150 years of data, appears to have an uncanny ability to predict future S&P 500 returns.

Unfortunately, the benefits of using this tool for actual investment decisions appear to be limited. The Shiller CAPE, along with all asset class valuation measures, has the following significant weaknesses and issues.

  • Selection bias has likely overstated the reliability of predicting future expected returns.
  • Using CAPE to shift between equities and T-bills doesn’t enhance risk-adjusted returns.
  • Using historical valuation data is susceptible to unpredictable long-term regime shifts that can devastate the effectiveness of such a tool.

When the Shiller CAPE is low, risks are high, and many competing asset classes are also priced cheaply. When the CAPE is high, competing assets also have low expected returns. It appears the S&P 500 is efficiently priced on the time scale used for value investing.

The best use of the Shiller CAPE is simply to set return expectations, specifically if valuation multiples revert to a long-term mean. Such expectations should also be contrasted with no-mean reversion return estimates, such as assuming the S&P 500 is simply priced to deliver a 3-5% premium over the current values of any of the following: T-bill yield, S&P 500 yield, 10-year treasury yield or inflation rate.


Introduction

The primary reason I write this blog is to reexamine the variety of asset class trading approaches I’ve used for years. I don’t want to waste time implementing tools that appear useful, but ultimately fail to enhance risk-adjusted performance. In this post, I examine Shiller CAPE, which should have implications for using historical valuation charts in general and asset class valuation tools produced by firms such as GMO, Research Affiliates and many others.

The most popular stock market valuation tool right now is the Shiller CAPE ratio. The Shiller cyclically adjusted price-to-earnings (CAPE) ratio divides the S&P 500 price by the average of the past 10 years of earnings.1-3 The averaging helps smooth out earnings volatility associated with recessions. Investors love this model because it’s very intuitive and appears to be quite good at predicting future equity returns.

Over the past five years or so, I’ve been reluctant to overweight U.S. stocks in my discretionary portfolios due to the belief that U.S. stocks were significantly overvalued based on the Shiller CAPE ratio. Unfortunately, that hasn’t worked as U.S. stocks have been the top performing asset class over that period. (more…)