
 In any competitive field, the awareness of tells can provide a significant and enduring edge. Most people think of poker when they hear about tells.1 Is a player acting strong to encourage other players to fold? Does a player seem nervous when they throw their chips in the pot? Can any useful information about an opponent’s poker hand be gleaned from these actions?
Tells occur in many aspects of life and competition. For most sporting events, searching for tendencies in an opponent’s play is an integral part of game preparation. In the home arena, parents look for facial clues when interrogating a fidgety teenager as the youngster explains what she’s doing on a Saturday night.
Tells are an important source of feedback when trading the financial markets. I call these “market tells” to distinguish between the variety of tells that occur in other forms of competitive environments (more on this distinction later). A market tell is a powerful approach to sensing moments in time when market participants are not positioned correctly.
A simple example of a market tell is a stock that’s acting strong when it should be weak. Perhaps the stock is in an uptrend when extremely bearish news is released about the prospects of the company (such as a product recall). Unexpectedly, after a momentary dip on the news, the stock price continues to go higher. That’s a positive tell for future outperformance.
Properly identified, tells can get you out of a trade much sooner than waiting for a technical trend-following sell signal. Tells can help you identify future outperforming asset classes. They can provide positive feedback that a current trade is working. No matter what your trading discipline or time scale, searching for market tells is a great trading edge.
The more you clarify and develop your thoughts around market tells, the more confidence you’ll have to quickly jump on trades and to trade with high conviction and size. I began noticing market tells soon after I started trading in the late 1990s. In 2005, I decided to be more disciplined about it by keeping track of results. When I observed a tell, I printed out a chart and documented what I expected to happen, and then slipped the paper into my “market tells” folder. I also traded on this information, and over the next four years, avoided looking at the results.
In mid-2009, I checked to see how these predictions worked. The success rates for these trades at both the short and intermediate time scales were excellent. These results piqued my interest to further investigate and refine the use of market tells in my trading. In 2014, I performed yet another trade analysis, and in 2017, I find myself slightly reshaping my views while writing this blog.
Classification of Tells
To provide a framework for thinking about market tells, I’ll review various forms of tells.
Tells when your opponent is trying to fool you
These tells occur in all forms of competition – sports, war, negotiations and interrogations. Ancient books of Chinese stratagems offer all sorts of lessons regarding opponents appearing weak or overtly acting strong as a signal of deception.2-4
The general rule around this tell is that when an opponent is acting strong, they’re hiding a weakness, and when an opponent is acting weak, they’re setting a trap for you (they’re strong). This is what makes poker so much fun, and it’s part of the gamesmanship associated with any sort of negotiation.
In the financial markets, this sort of tell does not apply. There’s an adage in poker that the more people you try to bluff, the less likely it will work. There are thousands of opponents in the financial markets – plenty of traders to “look you up” if you attempt to “bluff” the market.
And by the way, bluffing in the financial markets is essentially manipulation, which is illegal. At the asset class level, examples of manipulation include the recent Libor scandal, or when the Hunt brothers attempted to corner the silver market in 1980. The robber barons of the late 1800s were very sly in how they bluffed and manipulated the stock market for their own benefit.
Searching for mispriced securities due to someone else’s manipulation can work in principle, but these tells are not the subject of this blog.
Exploitation of systematic tendencies
Generally, an opponent or third-party agent providing these tells is unaware they’re furnishing useful information. There are all sorts of poker tells that fall into this category including betting patterns, glancing at chips, rechecking hole cards and many more.1 Many years ago casinos stopped letting blackjack dealers check hole cards to eliminate unintended information being transferred to sophisticated blackjack players. In warfare, Sun Tzu suggested looking for clues associated with enemy troop activities, such as observing birds taking flight and dust cloud formations.4
Searching for these tendencies in the financial markets can be a profitable trading edge, although these tells are not discussed in this blog. An example may be clueing in on the tendency of a large foreign institutional buyer placing orders near the close of each day.
Anecdotal tells
An example of an anecdotal tell is the “always wrong” person who seems to be late to every trade, or is perpetually buying or selling at the wrong time. It’s tempting to take the other side of such a person’s trades, or to be wary when this person joins you in a trade.
There are also anecdotal signs of a stock market top,5 such as when the stock market makes the cover of a national news magazine (or the equivalent in today’s digital age). Another anecdotal tell is the sudden rise of cocktail party chatter about stocks and everyone getting rich. Or maybe someone who usually has no interest in financial markets talks your ear off about getting rich in the markets.
If you manage money for lots of retail clients, then occasionally questions about an underperforming asset class can crescendo, which can be a sign that trends are about to turn. A sudden surge of client questions about missing out on a top-performing asset class can signal a local top. An industry conference where everyone is bullish and congratulating themselves can also be an anecdotal signal of a top.
I’m not sure if there’s useful information with anecdotal tells because it’s very easy to remember the few times they worked, and forget all the times when such a signal was too early. I still remember thinking that Apple stock (Symbol: APPL) had jumped the shark when I saw the Samsung “The Next Big Thing Is Already Here” TV commercials in September 2012. I didn’t act on that feeling, although Apple stock peaked at that time, but this moment was burned into my memory.
I’ve had my doubts about anecdotal tells, so I’ve not kept track of them for myself.
Market tells
A market tell occurs as the result of the combined actions of thousands or even millions of market participants. In typical market action, prices move to reflect the collective wisdom of all market participants. Sometimes prices overshoot the fundamental price; other times prices undershoot. Eventually, any systematic tendencies associated with these overshoots and undershoots tend to be ironed out as hedge funds and traders search for and exploit these trading edges. Ultimately, the efficient markets view wins as prices unpredictably jiggle near fundamental price due to this arbitrage activity.
Occasionally the multitude of market players (traders, fund managers and investors) lean too far in one direction and leave a clue that market prices have not been set properly. That’s a market tell. It’s an unknowable situation, at least ahead of time, so the use of market tells to provide a trading edge will not be arbitraged away. Depending on your trading time scale, months can go by without a market tell presenting itself. The lack of market tells suggests that the arbs are getting it right – at least to our ability to distinguish a market tell from general market noise.
Market tells are much like the motivated selling edge. Motivated selling opportunities occur when there’s a momentary lack of arb firepower to compensate for large selling pressure, leading to a price that is momentarily pushed below its fundamental price. It’s an unpredictable moment that can be exploited if you’re constantly hunting for these opportunities.
What is acting strong when it shouldn’t be? We want to be a buyer of such a security. What is acting weak when it shouldn’t be? We want to be a seller of that security. This is not a new concept, so you must continually develop the skills to quickly identify a market tell and act on it before most traders. All the great books that interview successful traders offer glimpses of how these pros use market tells in their trading.6-10
How to Identify a Market Tell
The markets are very noisy, so you need to search for extreme situations to distinguish a tell from everyday market movements. A market tell occurs when a security fails to move as expected considering fundamental news, technical signals, correlations – it essentially fails to move as expected in the “trading playbook.” The edge associated with acting on this information is generally fleeting for short-term signals, although there’s often plenty of time to act on intermediate-term tells.
Sensing market tells takes a lot of experience and subjectivity. Veterans in any competitive arena often develop a 6th sense that something doesn’t seem right and act on that information. The best traders also adapt to the everchanging playbook used to define a market tell.
To provide a little more rigor for identifying a market tell, here are my guidelines.
The normal must occur at least 80% of the time
The “normal behavior” used to define a market tell must be very reliable, then the unusual behavior is truly rare and can thus provide useful information. If the normal occurs 60% of the time, then it’s too difficult to distinguish the unusual behavior from general market randomness.
For instance, a failed price breakout to the upside can be thought of as a tell, but failed breakouts occur all the time. Because the frequency of a failed breakout is much larger than 20%, you can’t use it as a tell for future weakness.
You can be somewhat flexible on the 80% because you often don’t know what the real probabilities are. Even with back-testing, calculated probabilities are just an estimate of true probabilities, and the odds can change as markets evolve. To be somewhat flexible, 75% is okay, and perhaps even 70% can work if there’s not enough data, or if a few recent failures dropped the win % associated with normal occurrences. There’s an art to this. Keep track of results – if you tend to overestimate the fraction of normal instances, then you can adapt.
The “usual market action” must be logical and make financial sense
During a 10% market correction, a high beta equity asset class should underperform the market. This is the usual behavior because it makes logical sense. If you see a high beta equity asset class outperform when it should underperform during a sell-off, then that can provide a basis of a market tell.
It’s very easy to develop a back-tested indicator that works 80% of the time. For example, if the third week of August has been up in 9 of the last 10 years, a down week will not be a good basis for a tell because the logic associated with this behavior is lacking.
The correct time frame for the tell must be established
The trading edge associated with a market tell has a half-life on the order of the time scale of the behavior used to establish the tell. Every time I document a tell, I also predict the time scale of effectiveness. A tell indicated by an asset class doing well during a 3 to 6 month seasonally weak period should be expected to work for the next 3 to 6 months. A tell associated with unusual daily behavior should be expected to provide an edge that is on the order of a day or two. Take care to not go too far in interpreting a stock’s unexpected reaction to news as anything more than a short-term trading edge.
The tell must be underfollowed
If everyone is talking about a potential tell, such as the January barometer, then the chance of it working is much lower. Any tell that can be mechanically implemented is at risk of being arbitraged away, compared to a tell that is more gut-feel derived.
Security Acting Strong When It Should Be Weak
If you actively follow the markets, you’ll notice moments in time when a security or asset class is acting strong when it should be weak. The first step in using this information is to apply the 80% rule, which voids a lot of market action. For instance, observing the Russell 2000 down on a day the S&P 500 is up, or seeing the emerging market ETF (VWO) up when the S&P 500 is down may seem unusual, but probably is not a market tell. Such behavior can often be explained by the current playbook, such as a sharp drop in the dollar index (DXY). If the movements can be explained by news or the current playbook, then the behavior is not unusual in the first place.
An example of an indicator that doesn’t meet the 80% rule is the failed breakdown or breakout as described in Schwager on Futures: Technical Analysis.11 A failed breakdown occurs when the price falls below a major support level, keeps falling for a couple days, and then reverses itself and surges higher. Perhaps there was a time when a technical breakdown through support was 80% reliable in predicting lower prices, but nowadays prices break through support and reverse all the time. It’s not a rare occurrence.
It’s hard to find price patterns that are 80% reliable without the help of overfitting market data. However, price patterns can become reliable during moments of high stress since the playbook is very clear on what should happen. What are various securities and asset classes doing during a 10% correction in the S&P 500? Which asset classes are performing well coming out of a bear market bottom? How did various risky asset classes react to a sudden unexpected shock to the system? The deeper and more emotional the drawdown, the better the environment is to find market tells.
Figure 1 shows the behavior of the Vanguard Emerging Markets ETF (Symbol: VWO) compared to the S&P 500 (Symbol: SPY) near the bear market bottom in February 2016. The playbook says that when the S&P 500 (purple line) broke through its January low, VWO (orange bars) should have also broken to new lows since VWO is riskier and more volatile. But VWO failed to break its January 2016 low, and thus it was acting strong when it should have been weaker. In times of stress, this divergence is providing a tell of future outperformance as seen by the blue relative performance line on the bottom clip. I’ve placed the white crosshair at the point where the VWO price broke through the previous local resistance level.
Figure 1. Emerging markets tell at the bottom of the 2015 to 2016 bear market.

Why did VWO diverge from the S&P 500? Perhaps it was a lack of sellers in VWO compared to the S&P 500 – all the weak hands had finished selling. Perhaps value-oriented institutional managers were using weakness to add to their emerging market positions. Perhaps VWO was underowned by traders, and they began to sense the need to cover their VWO shorts. Any of these explanations can work, and the price action signaled a market tell that the relative price of VWO to SPY was too low.
At most market bottoms, the S&P 500 will bounce over a few weeks and then retest the low, and perhaps retest the low again a month or two later. These retests and subsequent bounces are a perfect time to look for strong and weak acting asset classes. Not every 10% correction provides a market tell, but these highly stressful market environments are one of the few moments when the 80% rule can apply.
The “playbook” says that risky asset classes should trace the same pattern of the most liquid large cap equity asset class (currently the S&P 500). Assets that are riskier than the S&P 500 should underperform on the downside, and outperform on the upside. Safer, or defensive, equity asset classes should outperform on the downside and underperform on the upside. Note divergences in this behavior as a potential market tell.
What are the riskier assets?
- High beta asset classes should underperform the S&P 500 on the downside.
- Less liquid equity asset classes should underperform the S&P 500 on the downside.
- Crowded or overowned equity asset classes (leading into the sell-off) should underperform the S&P 500 on the downside.
- High momentum asset classes (leading into the sell-off) should underperform the S&P 500 on the downside.
- Asset classes that are fundamentally riskier at the time, perhaps an industry or a country’s equity market that is “causing” the sell-off, should underperform the S&P 500 on the downside. These asset classes were likely underperforming the S&P 500 going into the sell-off, such as financials leading into the 2008 bear market.
- Defensive equity asset classes, and equity-like asset classes (such as high yield bonds), should also trace the pattern of the S&P 500.
Another lesson associated with market tells is to respect the half-life associated with the edge. Figure 2 shows a plot of the iShares MSCI Italy ETF (Orange bars, Symbol: EWI) versus the iShares MSCI EAFE Index (Purple line, Symbol: EFA). During the 7% correction of EFA in February 2014, the Italian ETF should have been weaker and taken out the December 2013 low as EFA did. Italian stocks were riskier at the time due to their heavy weighting to banks and because Italy was a member of the so-called PIIGS economies (along with Portugal, Ireland, Greece and Spain) most likely to struggle in the post-crisis world.
As EWI broke to a new high for the year in mid-February (see the white crosshair in Figure 2), such price behavior was signaling future strength versus EFA. The time scale for the tell to work was on the order of two months, which was the time scale associated with the tell. As the blue relative strength line at the bottom clip in Figure 2 shows, outperformance did indeed occur, but then the blue relative strength line for EWI eventually rolled over. Likewise, in Figure 1, the tell is expected to provide an edge for a couple months after the February low.
A few times I’ve ignored the timescale associated with a market tell, which has led to inferior trade implementation.
Figure 2: Market tell associated with Italian stocks (EWI) versus the MSCI EAFE in 2014.

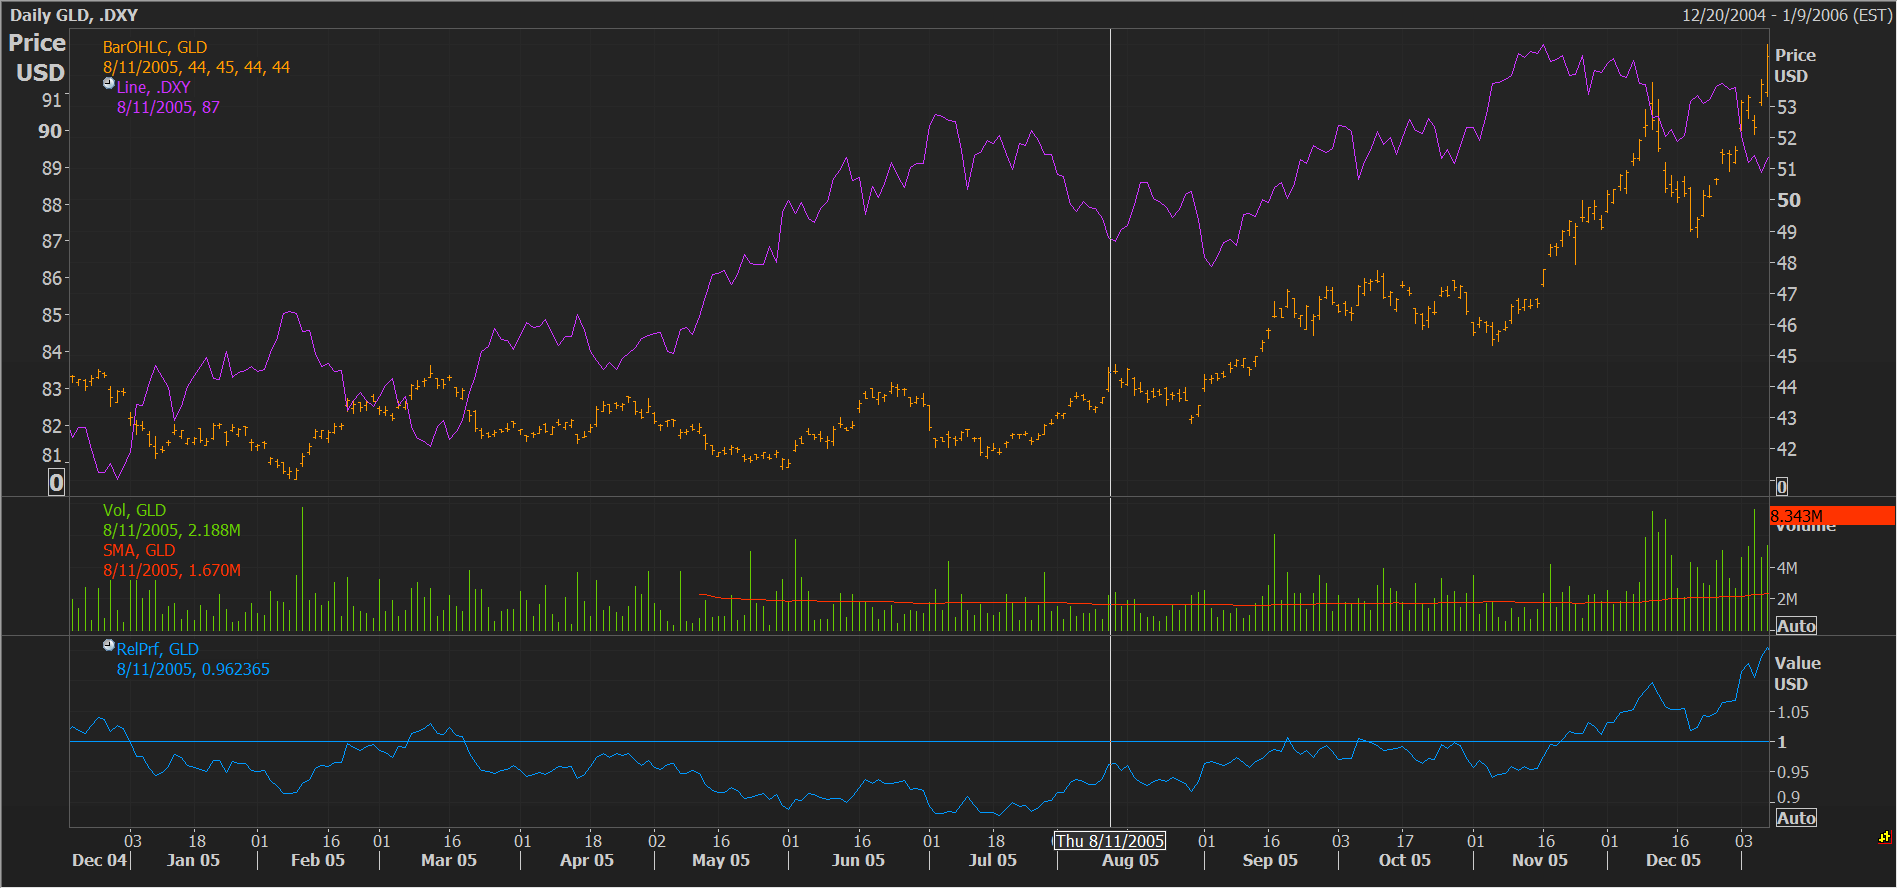
Figure 3 shows another example of an asset class acting strong when it should be weak. In this case, we’re observing a breakdown in the normal behavior associated with gold and the dollar index. Figure 3 shows the SPDR Gold ETF (Symbol GLD – the yellow bars) in 2005 compared to the dollar index (Symbol: DXY) shown in purple. Gold generally moves inversely with the dollar (as the dollar goes up, gold goes down). This pattern is followed to about May or June 2005 until gold failed to make a new low as the dollar index rallied higher. Gold was acting strong in the face of a rapidly rising dollar, and thus could be assumed to gain in value should the dollar flatten out or do very well if the dollar corrected lower.
At some point in June, or August, or September 2005, gold was a buy, and a market tell was signaled by the July low being higher than the June low. This was in turn higher than the February low, all during a period where the dollar index was marching to higher highs. Such a tell in September indicated a positive future six-month period for gold.
Figure 3. Market tell associated with gold and the dollar index in 2005.
Another example in Figure 4 shows the Japanese yen’s price action (using the Guggenheim CurrencyShares ETF – Symbol FXY) versus the S&P 500 Index in 2010. At the time, the yen was the premier risk-off currency because, among other reasons, it was the lowest interest-rate funding currency for the carry trade.
Figure 4: Market tell associated with yen strength during a risk-on environment in 2010.

You can see this behavior during the March to June time frame when the yen (the gold bars) moved inversely with the S&P 500 (purple line). Yet this behavior changed in July and August when the yen rallied as the S&P 500 rallied. At this point in time, going long the yen is a trade that’s aligned with a market tell. This positive action was reinforced during the S&P 500 pullback in August/September and its subsequent rally through October.
Figure 5: Market tell associated with Russell 2000 outperforming the S&P 500 in a bear market in 2001.

The final example, shown in Figure 5, shows the Russell 2000 (orange bars) versus the S&P 500 (purple line) in 2001. During the sell-off from late January to the beginning of April, the S&P 500 lost 20%, while the Russell 2000 outperformed on the downside (as shown with the blue relative strength line in the bottom clip). This is rare, and even during the sell-off from September to December 2000, the Russell 2000 matched the S&P 500, which is also a sign of strength. This is a market tell with some staying power, suggesting that the Russell 2000 should outperform for the next 3 to 6 months or more. This was indeed the case as large cap U.S. stocks had embarked on a multiyear period of underperformance due to the popping of the 1990s NASDAQ bubble.
In this case, the unusual price action was signaling that institutional investors were perhaps slowly moving from U.S. large cap stocks into small cap stocks. Or, the ownership of U.S. large cap stocks was so high that there were significantly more sellers of the S&P 500 than the Russell 2000. Either way, market participants were not correctly pricing the Russell 2000 versus the S&P 500. At major secular turning points, there are often strong intermediate-term market tells because these are moments in time when most market participants have not adjusted to the new regime.
Security Acting Weak When It Should Be Strong
We want to avoid asset classes that are acting weak when they should be strong. In June 2014, oil prices began a severe two-year bear market as prices fell from over $100/barrel to less than $30/barrel. Figure 6 compares oil prices (Symbol: CLc1) in the gold bars with the S&P 500 ETF (Symbol: SPY), represented by the purple line, at the beginning of this collapse in 2014. As oil prices relentlessly fell in 2014, other markets began to take notice, leading to an 8% correction in the S&P 500 in September/October 2014.
It was a panicky time, with the VIX spiking above 30. The S&P 500 bottomed in October and surged higher, making a new high at the beginning of November. Oil prices, which were hardest hit during this decline, should have at least half-heartedly bounced as all risky asset prices rose with the S&P 500, and as the VIX fell. Oil’s wimpy price action was a clear signal for continued weakness for oil prices. Energy stocks and Russian stocks also struggled to rally as a further sign of weakness. Oil broke to new lows in early November (see the white crosshair in Figure 6). Since the pattern took a month or two to form, the time scale of further oil weakness associated with this tell was on the order of a couple months.
Figure 6. Market tell associated with oil prices in 2014.

Another example of a security acting weak when it should be strong is the yen in 2016, as Figure 7 shows. When bearish on a classic risk-off asset class, watch for how the asset class does in a risk-off moment. The yen is a classic risk-off asset class since it’s generally used as a funding currency.
Figure 7. Market tell associated with the Japanese yen in 2016.

In October 2016, there were many reasons to short the yen. Their central bank was determined to weaken the yen to fight deflationary forces. The Japanese government debt/GDP ratio is extremely high. Shorting the yen is often a crowded trade, and it seemed that traders had been washed out of the short-yen trade by the large November 2015 to September 2016 rally. The yen appeared to be topping and the upcoming seasonally weak period (November to January) was coming up.
After the Brexit vote in June 2016, the yen rallied as expected as all risky assets took a dive on the news. The British pound (in purple, Symbol: FXB) collapsed on the news. Later in October 2016, there was a Brexit-light moment when the British pound rolled over dramatically through the previous Brexit lows. While the second sell-off in the pound created lots of headlines in the financial press, the yen fell during this later sell-off even as stocks briefly sold off and the VIX spiked.
The yen should have been strong in this environment, but it was weak. This was a great timing signal for further weakness in the yen, which ultimately collapsed in November/December.
The final example was also discussed in my blog on seasonality. Often we hear about the January barometer, stating that if January is up, then the rest of the year should be good, but if January is down, the rest of the year should be difficult. Unfortunately, this indicator doesn’t pass any of the guidelines I use to identify a market tell.
January is not up over 80% of the time; the S&P 500 is up only 62% of Januarys since 1950. Second, the time frame is off – the price action dictating the tell is just one month, but the barometer is used to say something about the remainder of the year. Third, the seasonal cycle is a six-month-on, six-month-off pattern. It doesn’t make sense to base a tell on just one of those risk-on months. Finally, the tell is popular, so there is probably some worry about the future effectiveness associated with the tell. I don’t think many people trade of this signal, though – it’s more for entertainment purposes for journalists and market strategists.
As described in the seasonality blog, one seasonal tell is to observe the seasonal strong period (November to April). When stock market returns are poor, then expect extra weakness during the seasonally weak period (May to October). This is a classic “the market is acting weak when it should be strong” market tell. Schwager12 also describes using seasonal patterns to derive tells in a variety of markets.
Table 1 shows the stats associated with this seasonal tell. On the left, the stats associated with S&P 500 performance over 62 weak periods is shown from 1954 to 2015. This period is generally weak with the S&P 500 outperforming T-bills only 61% of the time, and producing a return that is on average only 41 bps above T-bills.
In 12 of the 62 years (19% of the time), the S&P 500 produced a negative return during the previous seasonally strong period (November to April). The S&P 500 was acting weak when it should be strong. Such performance triggered the seasonal tell for the upcoming seasonally weak period.
When this tell was activated, the stats for the S&P 500 during the weak period are noticeably worse (as shown in the final two columns of Table 1). This is an actionable tell for lightening up on risky-asset exposure during the weak period.
Table 1: Seasonal tell for the S&P 500.

Conclusions
Market tells are moments in time when prices fail to act within well-defined “playbook rules.” The unusual behavior is an indication that the multitude of market players (traders, mutual fund managers, hedge fund managers and investors) are leaning too far in one direction such that the security or asset class is temporarily mispriced compared to fundamental value.
It’s an unknowable situation, at least ahead of time, so the use of tells shouldn’t be arbitraged away. If the arbs are doing their job, which is usually the case, then market tells will not occur.
Since there are lots of competitors searching for tells, traders need to develop the skills to identify them quickly, and have the confidence to bet on them with size. Smart traders must also adapt to the ever-changing playbook. Correlations and market drivers change over time, and some tells stop working as they grow popular. The reliability of the playbook can also change, which invalidates tells using such information. The markets are very noisy, so I developed four guidelines to help traders distinguish a market tell from everyday market movements and random noise.
I provided many examples associated with “acting strong when should be weak” and “acting weak when should be strong” situations. These tells were associated with divergences during high stress environments, intermarket correlation oddities and unusual seasonal behavioral patterns. Tells can also be developed around other playbook rules such as how securities are acting at various cycle turning points such as the beginning of central bank tightening and easing cycles, sea change moments in investment approaches, behavior around bubbles, patterns leading into and out of elections and the four-year presidential cycle. On the shorter time scale, patterns around Fed meetings, option expiration dates, and other market moving events may form the basis for a tell.
In the next blog I’ll present more examples associated with market tells, involving the price reaction to unexpected news, market tone, sensing crowded trades, and market action in the face of persistent fundamental news. I’ll also contrast divergences and market tells during quiescent moments in the markets.
References
- Caro, M., Caro’s Book of Poker Tells, 2003.
- Sawyer, R.D., One Hundred Unorthodox Strategies: Battle and Tactics of Chinese Warfare, 1996.
- Von Senger, H., The Book of Stratagems: Tactics for Triumph and Survival, translated by Myron B. Gubitz, 1991.
- Sun Tzu, “The Art of War”, translated by Gary Gagliardi, 2001.
- Pring, M.J., Investment Psychology Explained: Classic Strategies to Beat the Markets, 1993.
- Schwager, J.D., Market Wizards: Interviews with Top Traders, 1989.
- Schwager, J.D., The New Market Wizards: Conversations with America’s Top Traders, 1992.
- Drobny, S., Inside the House of Money: Top Hedge Fund Traders on Profiting in the Global Markets, 2006.
- Drobny, S., The Invisible Hands: Hedge Funds Off the Record – Rethinking Real Money, 2010.
- Schwager, J.D., Hedge Fund Market Wizards: How Winning Traders Win, 2012.
- Schwager, J.D., Schwager on Futures: Technical Analysis, 1996, chapter 11 on failed technical signals.
- Schwager, J.D., Schwager on Futures: Fundamental Analysis, 1995, chapters 9 and 10 on seasonal analysis and seasonality.
Disclosure
The content contained within this blog reflects the personal views and opinions of Dennis Tilley, and not necessarily those of Merriman Wealth Management, LLC. This website is for educational and/or entertainment purposes only. Use this information at your own risk, and the content should not be considered legal, tax or investment advice. The views contained in this blog may change at any time without notice, and may be inappropriate for an individual’s investment portfolio. There is no guarantee that securities and/or the techniques mentioned in this blog will make money or enhance risk-adjusted returns. The information contained in this blog may use views, estimates, assumptions, facts and information from other sources that are believed to be accurate and reliable as of the date of each blog entry. The content provided within this blog is the property of Dennis Tilley & Merriman Wealth Management, LLC (“Merriman”). For more details, see the Important Disclosure.