
by Dennis Tilley | Jul 8, 2019 | Intermediate-Term Edge, Investing, Long-Term Edge, Trading Edges
Executive Summary
In the last of our asset-class valuation series, I discuss costly value traps that can derail even the best-reasoned asset-class value themes. A lot can go wrong when you bet on value. In particular, an asset class that appears to be an excellent value can stay that way for years.
All investors face this problem and most professional investors who manage billions of dollars have only one option, which is to leg into these investments over time. Asset class traders have the benefit of being small enough to wait for a catalyst before trading a compelling value opportunity. In this blog post, I review various catalysts I use to get the timing right and avoid the value traps.
Introduction
Most traders and investors know to be aware of value traps when investing in cheap assets. Value investors comment that risk of permanent loss is the true risk associated with investing, and a worst-case scenario is losing 100% of capital. Although asset classes rarely lose 100% of their value, value traps in the asset class arena are not much different.
My main concern when using the “compelling valuation” trading edge to overweight an asset class is that it underperforms an equity benchmark. In other words, if I own Korean stocks because I feel they’re irrationally cheap, and they underperform my benchmark during the hold period, then the trade didn’t work. Either I didn’t assess the situation correctly, or the timing wasn’t right, or perhaps fundamentals changed the assessment over time. The opportunity cost associated with this mistake is what hurts the most.
(more…)

by Dennis Tilley | Jun 20, 2019 | Investing, Long-Term Edge, Trading Edges
Executive Summary
- Asset classes trading significantly below intrinsic value occur infrequently, perhaps once every 10-20 years per asset class. We need to accept that asset pricing (for long hold periods) is rational and correct most the time, and that cheap asset classes are usually cheap for a reason.
- I discuss methods I use to determine when an asset class is irrationally mispriced well below long-term intrinsic value. I’m trying to distinguish a once-a-decade compelling valuation versus run-of-the-mill everyday value opportunities. Compelling values set up lucrative multi-year trades to the long side.
- While there’s no formula for identifying these opportunities, I present three steps I take in the search. First, I find prices that appear to be an extreme outlier with respect to history, logic and other asset class valuations. Second, I identify the behavioral effect causing the asset class to be mispriced compared to long-term intrinsic value. Finally, I ask myself a few common-sense questions, such as: If I was designing a portfolio to hold for the next 10 years, would I substantially overweight this asset class?
- A compelling value is a trading edge that’s long-term in nature, so an asset class can stay that way for years. Since it’s unknown when (or if) the market will recognize a compelling value, an asset class trader ultimately requires a timing catalyst to initiate the trade. Getting the timing basically right – for a move that can take years to unfold – is an important edge for the asset class trader compared to value investors and asset allocators.
 Introduction
Value investors typically hold cheap securities based on an analysis of future growth prospects and many valuation measures. They sell assets that rise in price (and hit price targets) and replenish the portfolio with cheaper assets that have recently suffered price drops. They manage the portfolio with a low turnover, typically 25% per year or lower. Many securities purchased may be underpriced due to irrational overreactions to bad news, but most are likely cheap for a reason – they are riskier or have inferior growth rates. This is particularly true for the value screens used by index-based value ETFs.
Contrary to adopting the value investor philosophy, as an asset class trader, I’m only interested in using the value approach when there’s a compelling opportunity. A compelling value at the asset class level is created by irrational human behaviors working on very long time scales to drive a price well below intrinsic value. Examples of such behaviors include long-term investor herding, industry-wide groupthink, gun-shy investors fearing a repeat of severe losses, and bubbles.
Sorting out what’s cheap and expensive among various asset classes is inherently difficult because asset classes have vastly different risk and return characteristics. It’s hard to compare Russian stocks with U.S. stocks because there are significant non-quantifiable risk differences. How can we estimate when growth stocks are underpriced? When do high-yield bonds have a better risk-adjusted expected return than equities? These questions are impossible to answer definitively.
Despite the difficulties, an educated guess that an asset class is undervalued, combined with a catalyst, can be a huge source of outperformance. In this blog post, I attempt to distinguish a once-a-decade compelling valuation created by long-term, irrational human logic and the “good values” we read about in research reports every day. (more…)

by Dennis Tilley | Dec 11, 2018 | Investing, Long-Term Edge
Executive Summary
In this post, I examine the popular stock market valuation tool, the Shiller CAPE. The Shiller CAPE valuation approach, based on 150 years of data, appears to have an uncanny ability to predict future S&P 500 returns.
Unfortunately, the benefits of using this tool for actual investment decisions appear to be limited. The Shiller CAPE, along with all asset class valuation measures, has the following significant weaknesses and issues.
- Selection bias has likely overstated the reliability of predicting future expected returns.
- Using CAPE to shift between equities and T-bills doesn’t enhance risk-adjusted returns.
- Using historical valuation data is susceptible to unpredictable long-term regime shifts that can devastate the effectiveness of such a tool.
When the Shiller CAPE is low, risks are high, and many competing asset classes are also priced cheaply. When the CAPE is high, competing assets also have low expected returns. It appears the S&P 500 is efficiently priced on the time scale used for value investing.
The best use of the Shiller CAPE is simply to set return expectations, specifically if valuation multiples revert to a long-term mean. Such expectations should also be contrasted with no-mean reversion return estimates, such as assuming the S&P 500 is simply priced to deliver a 3-5% premium over the current values of any of the following: T-bill yield, S&P 500 yield, 10-year treasury yield or inflation rate.
 Introduction
The primary reason I write this blog is to reexamine the variety of asset class trading approaches I’ve used for years. I don’t want to waste time implementing tools that appear useful, but ultimately fail to enhance risk-adjusted performance. In this post, I examine Shiller CAPE, which should have implications for using historical valuation charts in general and asset class valuation tools produced by firms such as GMO, Research Affiliates and many others.
The most popular stock market valuation tool right now is the Shiller CAPE ratio. The Shiller cyclically adjusted price-to-earnings (CAPE) ratio divides the S&P 500 price by the average of the past 10 years of earnings.1-3 The averaging helps smooth out earnings volatility associated with recessions. Investors love this model because it’s very intuitive and appears to be quite good at predicting future equity returns.
Over the past five years or so, I’ve been reluctant to overweight U.S. stocks in my discretionary portfolios due to the belief that U.S. stocks were significantly overvalued based on the Shiller CAPE ratio. Unfortunately, that hasn’t worked as U.S. stocks have been the top performing asset class over that period. (more…)

by Dennis Tilley | Oct 31, 2018 | Investing, Long-Term Edge, Trading Edges
Executive Summary
- This is the first of a multi-part series examining the use of valuation approaches to identify future outperforming asset classes.
- I discuss why value investing is an essential and useful tool for asset class traders.
- I briefly discuss the Warren Buffett approach as the purest form of discretionary value investing.
- I clarify the distinction between fair value (a concept I’ve used to discuss short-term trading edges) and intrinsic value used by value investors.
- I briefly review the vast academic literature on mechanically value-tilted portfolios. These portfolios are typically heavily weighted towards cheap and risky assets. These cheap securities are most often fairly priced to deliver long-term returns that are superior to a market cap weighted basket of similar securities.
- Finally, I introduce Asset Class Value Investing as: identifying moments in time when an asset class appears to be irrationally mispriced based on an assessment of long-term intrinsic value.
 Introduction
As asset class traders, we must understand the current thinking built into asset class prices. Prices are generally determined by the actions of a global set of large institutions, pension funds, endowments, sovereign wealth funds, banks, mutual fund managers and hedge fund managers considering future prospects and risks. Finding trading opportunities requires us to get into the heads of these large market players.
Many large firms specialize in one or a few asset classes, while other large institutions focus their attention at the asset class level. Most organizations are too big to actively buy and sell securities; they need to act on longer time frames.
The question of assessing an asset class’s relative value is particularly topical right now. U.S. growth stocks continue to outperform all other asset classes despite being “overvalued” for the past 5 or so years. Meanwhile, international and emerging market stocks continue to sink, despite trading at a fraction of U.S. equity multiples. Furthermore, across the global stock market, the value style has underperformed growth stocks for over a decade, despite strong evidence value stocks outperform over the long term. The current market seems a lot like the late 1990s all over again. (more…)

by Dennis Tilley | Apr 27, 2018 | Intermediate-Term Edge, Investing, Long-Term Edge, Market Timing, Trading Edges, Trend Following
Large price runups, such as a gain of 100% over two years, are rare.1 In a previous blog post, I presented 10 attributes to distinguish asset class bubbles from large price runups that are justified by improving fundamentals. Those bubble attributes are:

- Heavy retail investor involvement
- New-era thinking
- Irrational valuations
- Five or more years of swiftly rising prices
- Parabolic rise in price
- Shorting is unattractive or impossible
- Social mania
- Product providers exploit excessive demand
- Leverage fuels more buying
- Bubbles are late-cycle phenomena
As asset class traders, we are especially interested in bubbles as a potential huge source of alpha when they collapse. As it turns out, bubbles are a lot tougher to exploit than it might seem. In this blog post, we’ll delve into bubble characteristics in more detail, and then investigate the best ways to trade asset classes that are experiencing a bubble.
We’ll examine bubble characteristics over the short term (plus and minus three years around the peak) and then longer term (a decade or more). When doing this sort of analysis, we need to at least acknowledge that various forms of hindsight bias can creep into such work since we are examining known price runups that ultimately crashed spectacularly.
It’s possible that we should include a few historical parabolic runups that did not ultimately pop.1 I’m hopeful that the lack of bubble attributes associated with these moves provides the justification for eliminating these from consideration, but I’m not completely sure. I may have also declared a few large up and down moves as bubbles (for instance, Chinese equities in 2007), when perhaps this price move had no more bubble attributes than a big move that ultimately didn’t end in a long period of underperformance (for example, the 1987 crash). (more…)

by Dennis Tilley | Dec 18, 2017 | Investing, Long-Term Edge, Technical Analysis, Trading Edges
 Often in trading we become totally engrossed in searching for short-term opportunities with a hyper-focus on news flow and daily price movements. Occasionally it’s good to drastically alter time frames, especially if your creativity has dried up on short-term ideas. One way to search for new trades is to scan asset classes that have performed the worst over the previous decade. This is especially interesting when there’s been a large divergence of performance in asset class returns over the previous 5 to 10 years.
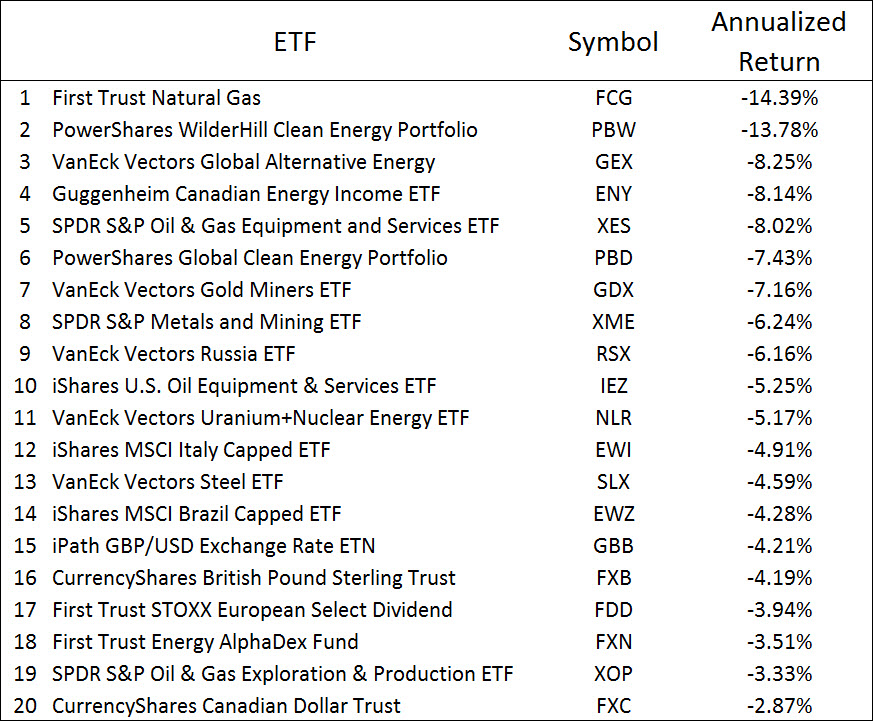
Table 1 shows a ranking of the worst-performing ETFs by 10-year annualized returns as of October 31, 2017. When tabulating this ranking, I excluded the ProShares daily leveraging funds and commodity exchange traded notes. For comparison, the S&P 500 returned 7.51% per year during this time frame. This list contains many ETFs in the energy space, with a few niche asset classes (clean energy, gold miners, steel and nuclear), country funds (Russia, Italy and Brazil) and two currencies (British pound and Canadian dollar).
Table 1: Worst-performing U.S. ETFs based on 10-year annualized returns, as of October 31, 2017. (Note: S&P 500 return over same period was 7.51%/year). Source is Morningstar.
Often these asset classes were popular many years ago, but as the terrible performance persisted over a decade’s time, more and more traders and portfolio managers shifted their focus to better-performing asset classes. With a niche asset class, such as gold mining or solar energy stocks, the last remaining holders are the enthusiasts (gold bugs), index funds and retail investors owning such a small position that to them it’s easier to ignore rather than take a loss on a sale. (more…)