by Dennis Tilley | Jul 12, 2021 | Investing, Technical Analysis
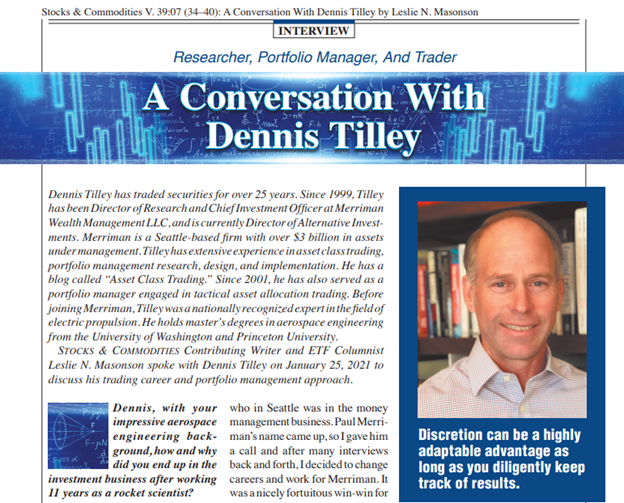
I was recently interviewed by Technical Analysis of Stocks and Commodities, and my interview was published in the July 2021 issue.
The past 18 months have been a heartbreaking period of human angst and suffering as the COVID-19 pandemic came out of nowhere to wreak havoc on the world’s economy, expose rifts, and accelerate all sorts of technology trends. For an asset class trader, the period was rich with opportunities. My focus during this time has been on portfolio management and applying all I have learned during the past 25 years to navigate this unprecedented period in the markets.
I hope to get back to writing and reflecting about what works in asset class trading in the near future. As always, published blog posts are intended to be timeless in nature, so new readers should not hesitate to read articles written years ago.

by Dennis Tilley | Dec 18, 2017 | Investing, Long-Term Edge, Technical Analysis, Trading Edges
 Often in trading we become totally engrossed in searching for short-term opportunities with a hyper-focus on news flow and daily price movements. Occasionally it’s good to drastically alter time frames, especially if your creativity has dried up on short-term ideas. One way to search for new trades is to scan asset classes that have performed the worst over the previous decade. This is especially interesting when there’s been a large divergence of performance in asset class returns over the previous 5 to 10 years.
Table 1 shows a ranking of the worst-performing ETFs by 10-year annualized returns as of October 31, 2017. When tabulating this ranking, I excluded the ProShares daily leveraging funds and commodity exchange traded notes. For comparison, the S&P 500 returned 7.51% per year during this time frame. This list contains many ETFs in the energy space, with a few niche asset classes (clean energy, gold miners, steel and nuclear), country funds (Russia, Italy and Brazil) and two currencies (British pound and Canadian dollar).
Table 1: Worst-performing U.S. ETFs based on 10-year annualized returns, as of October 31, 2017. (Note: S&P 500 return over same period was 7.51%/year). Source is Morningstar.
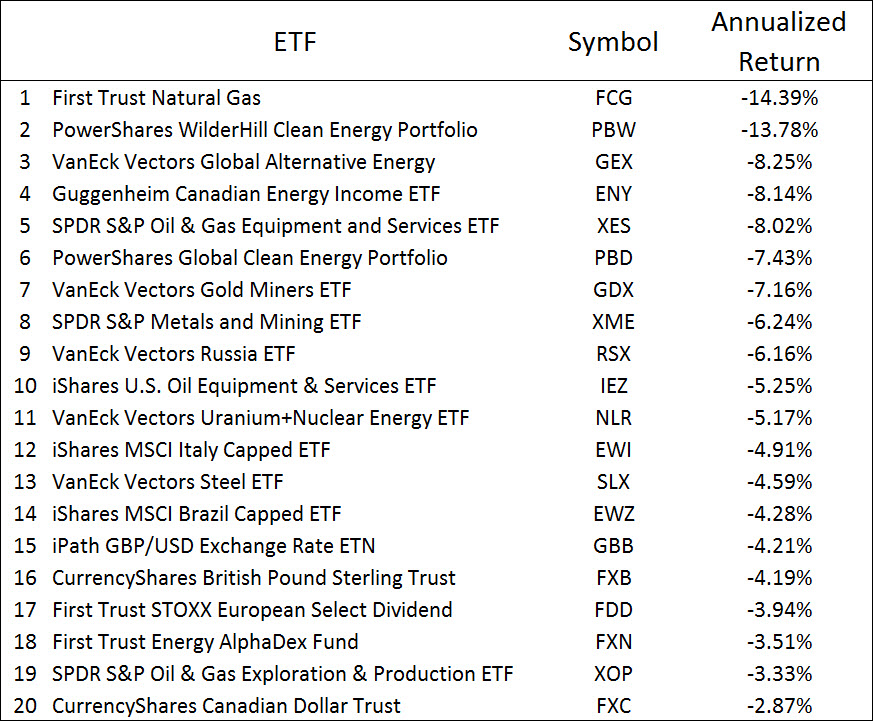
Often these asset classes were popular many years ago, but as the terrible performance persisted over a decade’s time, more and more traders and portfolio managers shifted their focus to better-performing asset classes. With a niche asset class, such as gold mining or solar energy stocks, the last remaining holders are the enthusiasts (gold bugs), index funds and retail investors owning such a small position that to them it’s easier to ignore rather than take a loss on a sale. (more…)
by Dennis Tilley | Dec 16, 2015 | Technical Analysis, Trend Following
Cut your losses short, and let your profits run.
For centuries, that’s probably the number one trader’s adage. This is exactly what the trend following (TF) investment discipline does – using simple rules to be long markets in uptrends and short markets in downtrends. The mathematical rules used to identify uptrends and downtrends are predefined and mechanically implemented to eliminate human emotions in deciding when to be in or out of a market.
The most common way trend following is implemented is with managed futures funds, which are typically placed in the “alternatives bucket” of an investment portfolio, perhaps making up 5% of the total.  A good example of such a fund is the AQR Managed Futures Strategy Fund (Symbol: AQMIX). Managed futures funds apply the trend-following discipline to various equity and fixed income markets, along with currency pairs and commodity futures.
In this blog, I’ll examine the trend-following approach applied to asset classes that have a positive risk premium above inflation and T-bills, which are stocks and bonds. In addition, the focus will be to shift into cash when stock and bond trends are down, rather than more aggressively shorting downtrends. This is traditionally the realm of market timing, hence my distinction using the title “Trend-Following Market Timing”.
It’s an open question for me about whether managed futures funds add value over the long term, and this is worthy of a future blog piece. Generally, shorting stocks on a TF signal doesn’t work very well in the long term, but it does reduce managed futures fund correlation to stocks, and provides “bear market insurance” for a diversified portfolio of stocks and bonds. If you believe, as I do, that currency pairs and commodity futures do not deliver a long-term return above T-bills, then what kind of return can we expect from applying a trend-following overlay to these markets? I’m not sure what the answer is, so I won’t be addressing that question in this blog.
Everything I write beyond this point about trend following applies to the market-timing view of shifting between stocks and cash, and asking whether such an approach provides any sort of trading edge. (more…)
by Dennis Tilley | Nov 12, 2015 | Technical Analysis, Trading Edges, Trend Following
 An essential component of successful trading is having a good sense of timing. The standard industry tool for getting the timing right is technical analysis, so we need to examine its effectiveness. I’ll assume the reader is familiar with technical analysis, and as an asset class trader, I’ll also assume we control a limited amount of assets such that positions can be bought and liquidated with minimal trading impact costs.
For extremely large asset management firms and hedge funds, technical analysis is not an available tool because all-in trading costs are prohibitively expensive with this approach. These firms are forced to use other approaches such as value investing, which is, ironically, a horrible tool for timing price moves. Even large trend following CTAs are forced to use the most liquid futures contracts to minimize trading impact costs. So perhaps being small and using technical analysis is an advantage for us.
In a nutshell, technical analysis is the analysis of price and trading volume patterns to identify current and future price uptrends, downtrends and trend turning points. Practically all trading “how-to” books rely almost exclusively on technical analysis. Technical analysis techniques and patterns appear to be valid on all time scales and with any tradable security.
I gravitated to TA rather quickly when I first started trading, because as a full-time engineer, trading was a hobby. I didn’t have the time or expertise to dig through how the “fundamentals” influenced prices. I read many books on technical analysis and trading. The classic books are still the best,1-4 while most others fail to provide additional insight. In the next few blog posts I’ll talk about technical analysis, trend following and backtesting issues associated with mechanical trading models. Nowadays, I still look at charts and use basic technical analysis, but I don’t expect too much from it. (more…)