
Executive Summary
There are many smart investors who’ve taken a shining to gold in recent years. Their reasons are many, including negative real interest rates around the world, central bank buying, and rapidly rising production costs. In addition, gold can provide insurance for all sorts of nasty financial outcomes that appear quite possible due to excessively high debt-to-GDP levels and high wealth inequality. Such outcomes and worries include the rise of populism, money printing, trade wars, competitive devaluations, unconventional monetary policies, an unexpected rise of inflation and the vulnerability of the U.S. dollar to a significant decline. Even a run-of-the-mill recession may trigger significant pain and uncertainty for the markets.
In this post, I discuss two unappreciated and compelling reasons to own gold that go beyond what is mentioned above. The first is that gold is significantly under-owned among U.S. investors. Many investors think they’re covered by owning a few gold coins in a safe deposit box. This is not enough gold exposure. I compare U.S. gold ownership with stocks, bonds, and real estate going back to 1900. These charts show that gold ownership is near historic lows, while central bank quantitative easing has bid up financial assets to all-time highs as a percentage of GDP.
Second, using mean-variance portfolio mathematics, one can show that replacing a small portion of government bonds with gold will enhance future portfolio risk-adjusted returns if real interest rates stay below 0% and gold returns simply match inflation. These assumptions are realistic considering that holding rates below inflation is the least painful way central banks can slowly reduce debt levels over time.
In the past decade, investors have combated low bond yields by replacing bonds with liquid alternatives, hedge funds, managed futures funds, and commodity funds. During this time, alternatives have over-promised and under-delivered, barely beating T-bill returns, net of fees. If real T-bill yields remain negative over the next decade, expect alternatives to continue to disappoint. Increasing an allocation to gold from liquid alts may also make sense.
By selling a portion of bonds or alternatives, and placing the proceeds into gold, we can enhance future portfolio risk-adjusted returns while also owning financial chaos insurance. Such an allocation can also provide insurance for a scenario when stocks and bonds get hammered at the same time, which is a weakness of the standard 60:40 portfolio. A small allocation to gold belongs in today’s modern investment portfolios.
 Introduction

Figure 1 below shows the history of gold prices over the past twenty years along with the U.S. Dollar Index. Gold’s previous large-scale rally saw its price rise from $250 per troy ounce in 2001 to a peak of $1900 in September 2011. At the time, the European debt crisis was raging and central banks around the world were deep into their quantitative easing programs. Many of the reasons to be bullish on gold in 2011 are still around today, yet gold peaked then and fell over the next four years to a low of $1050 per troy ounce in December 2015. It’s hard to nail down exactly why gold peaked in 2011, but perhaps the market priced in all the bullish reasons to be long gold at the time. Another contributing factor is that the U.S. dollar bottomed in 2011.

Figure 1: History of gold prices from December 31, 1999 to December 31, 2019.
In June 2019, gold broke out of a five-year consolidation pattern as the German 10-year yield fell deeper into negative territory and 30% of the world’s bonds had negative interest rates. At the end of 2019, gold sat at $1517 per troy ounce. Table 1 shows the total returns of various asset classes since gold peaked in 2011. Compared to all in the table, gold has lost purchasing power since its high point. Compared to the U.S. inflation index, gold lost 17.5% of its purchasing power over that time frame, while gold underperformed U.S. stocks by almost 250%.

Table 1. Asset class performance since gold peaked in 2011.
The two U.S. Dollar indices also gained versus gold in the past eight years. As the world’s reserve currency, the U.S. dollar has a strong inverse effect on gold prices. The previous peak in the U.S. dollar in 2001 coincided with the start of the previous gold bull market.
Over the past couple of years, a few smart billionaire investors have promoted gold in this environment. I’ll briefly review their reasons below.
The Six Well-Known Reasons to Own Gold
Reason 1: Excessive Debt Levels around the World
Ray Dalio, the founder of Bridgewater Associates, has written a must-read study1 of secular debt bubbles and the various government policy approaches used to reduce debt levels over time. As shown in Figure 2, the total amount of debt issued in the United States is around 350% of GDP. This debt consists of federal and state government debt, mortgage-backed debt, corporate debt, consumer debt, student loans, auto loans, private bank loans, and more. The U.S. is not alone. Practically all countries have excessively high debt-to-GDP levels, in the 300% to 800% range. Once interest rates peaked in 1981, debt issuance grew steadily over the decades, reaching a high in 2008 for most countries.

Figure 2. United States debt as a percentage of GDP.
Copyright 2019 Ned Davis Research, Inc. Further distribution prohibited without prior permission. All Rights Reserved. See NDR Disclaimer at https://www.ndr.com/terms-of-service#disclaimer.
Why did debt grow to such high levels? Simply put, once interest rates peaked in 1981, debt has worked. It’s been a perfect environment to use debt. Since 1981, we’ve had only 3 recessions in 38 years – about one every ten years. During these recessions, central bankers had tons of room to reduce interest rates to “new lows” to rescue debtors by supporting asset pricing and improving debt-service costs. An environment of falling interest rates, rising collateral values and contained inflation is the only world most investors know.
Since 2008, when the secular debt bubble peaked, the U.S. (and the world) is working on what Ray Dalio calls a “beautiful deleveraging” process to slowly reduce debt levels. This process requires a careful balance of many levers to avoid pushing world economies into recession, and fairly spread the pain among constituents and over time. Central bankers have learned from past mistakes and, so far, the pain has been minimized.
All policies to reduce debt are supportive of gold long term. Financial repression, the preferred approach, keeps interest rates below inflation, helping slowly reduce debt-to-GDP over time by promoting economic growth, supporting collateral prices, weakening the currency, and keeping debt-service costs low. Financial repression is fully within the realm of central bank powers and is highly favored versus other options during quiescent economic times. Unfortunately, savers experience the pain of inflation slowly eroding their purchasing power.
In a crisis, or during a recession, more aggressive policies are required. First up is quantitative easing, used to inflate financial asset values, promote a wealth effect, and spur economic growth. Next up is money printing and debt defaults (in the private space). Please read Dalio’s free book titled “Principles for Navigating Big Debt Crises.”1 All these polices are favorable to gold.
Reason 2: The Rise of Populism
Dalio also published a study2 investigating the rise of populism and the policies associated with populist governments. Populism arises out of economic stagnation, wealth inequality, and political paralysis, all of which are trending higher in the world and the U.S. This year’s presidential election is certainly witness to that. Populists typically implement policies such as trade wars, currency devaluations, attacking corporations and foreigners, and starting wars. These policies create a lot of economic uncertainty and are supportive of gold prices. Donald Trump is a populist president from the right, and may soon be running against a left-wing populist in the upcoming presidential election.
Reason 3: Central banks are buying
Another well-known reason to own gold is that central banks have shifted from net sellers to net buyers of gold. This trend started after the Great Financial Crisis in 2009, with the largest purchasers being China and Russia. An excellent source of gold information used throughout this blog post, including central bank holdings, is the World Gold Council website.3
Reason 4: Lack of New Supply and Rapidly Rising Mining Costs
Billionaire real estate investor Sam Zell purchased gold for the first time in his career in 2018-2019. While attracted to the crisis-mitigation properties of gold, his reasoning was more of a boots-on-the-ground fundamental argument. He sees that production growth is slowing, mining costs have grown considerably, and there’s very little capital going into new production. The performance of gold mining stocks has been abysmal over the past decade, in part because the all-in costs of producing an ounce of gold has grown much faster than inflation. A recent McKinsey report on the industry highlighted the struggles of shrinking reserves and rising costs.4
Reason 5: Negative Real and Nominal Interest Rates
Interest rates are negative throughout much of Europe and Japan. The fraction of the world’s bonds trading at negative yields leaped to 30% in the third quarter to 2019, which was profoundly inconceivable before the Great Financial Crisis. Negative interest rates is essentially a new experimental monetary policy that has never been seen in the history of mankind, and central banks are in no hurry to raise interest rates. The U.S. central bank attempted to reverse this trend in 2016 by raising short-term rates up to 2.25%. This attempt to “normalize” interest rates turned out to be premature, as world economic growth quickly cooled because of an apparent intense sensitivity to interest rates.
U.S. TIPS are pricing in the negative real rates going out 15-20 years; and the coronavirus scare has caused the ten-year TIPS yield to fall to -40 bps. The market is pricing in at least ten years of negative real rates, yet gold seems to be priced as if rates will normalize during that time.
Reason 6: The U.S. Dollar is Vulnerable and Overvalued
The sixth and final well-known reason to be long gold is that U.S. government debt is getting close to breaching 100% of GDP with no signs of slowing. Currently, the U.S. government spends over a trillion dollars more than it takes in with taxes, which increases debt/GDP by 4-5% per year. Politicians on both sides seem uninterested in reducing debt levels. Figure 3 shows the level of U.S. government debt since the inception of our nation, as well as a projection of the future by the Congressional Budget Office.

Figure 3. History of U.S. Government Debt as a percentage of GDP.5
The last time U.S. debt-to-GDP broke 100% was after WWII. The U.S. central bank capped interest rates at around 2% up to 1951 while nominal GDP grew by 70% and inflation was 6.5% per year. That’s why debt-to-GDP fell so rapidly during the post-war period. World economies were also poised for massive growth following two decades of wars and the Great Depression.
Normally when the economy is booming, we expect the budget deficit to narrow, or perhaps turn positive. If the U.S. economy eventually falls into its next recession, tax revenue will collapse, and the budget deficit will balloon. Gold is an excellent hedge for this scenario, especially if investors begin to worry about the government’s printing press option.
Strong flows into U.S. dollar assets, chasing higher bond yields and higher equity returns, have no doubt supported U.S. asset prices and the dollar. In addition, the U.S. Dollar appears to be overvalued versus most currencies based on purchase-power-parity and the Economist Magazine’s Big-Mac index.
The U.S. economic dominance theme will eventually end, and when it does, I expect investors inside and outside the U.S. to be selling dollars to invest elsewhere in the world. Ultimately, these reasons suggest the dollar is highly vulnerable to a secular decline in the future, which will be very positive for gold.
To summarize, here are the well-known reasons smart investors are adding gold to their investment portfolios:
- Excessive Debt Levels around the World
- The Rise of Populism
- Central Banks are Buying
- Lack of New Supply and Rapidly Rising Mining Costs
- Negative Real and Nominal Interest Rates
- The U.S. Dollar is Vulnerable and Overvalued
Those in the precious metals business, a.k.a. the gold bugs, have of course highlighted the above justifications for holding gold. But their views must be taken with a grain of salt because they are always bullish on gold. When great investors like Ray Dalio and Sam Zell become attracted to gold, that’s a different story.
None of the reasons to be long gold listed above are new. Gold prices may have already incorporated this well-known information. Perhaps, investors have already looked ahead, and bid up gold prices in anticipation of these outcomes. For instance, gold may have a “sell-the-news” reaction if Bernie Sanders wins the election in November 2020.
There are two additional arguments for holding gold that investors may not realize, and for that reason I think they’ve not been fully incorporated into gold prices. First, gold is extremely under-owned among U.S. investors. Second, adding gold to a diversified portfolio can enhance risk-adjusted returns even if the inflation rate never accelerates beyond 2%. It’s as if the inflation/financial chaos insurance provided by gold is being provided at no cost.
Argument 1: Gold is Extremely Under-Owned by U.S. Investors
I remember reading Money Magazine in the early 1990s when I began investing. At the time, the conventional asset allocation advice for individual investors seemed to have a 5-10% allocation to gold or gold mining stocks. No longer; few pension funds or investment advisor portfolios have an allocation to gold.
I’ve spent considerable time developing measures of market capitalization of various asset classes since 1900. Most of this data can be found at the St. Louis Federal Reserve Economic Data (FRED) website. But I’ve also used data from other sources to fill the gaps and make estimates for earlier time periods.3,6-12 One book that’s interesting on this subject is Raymond Goldsmith’s “Comparative National Balance Sheets – A Study of Twenty Countries, 1688-1978,” which was published in 1985. From the data associated with these references, and some interpolation, I developed an estimate of how national wealth was distributed over time compared to U.S. GDP.
Figure 4 shows the market capitalization of U.S. stocks as a percentage of GDP. Stocks have been huge winners since the secular bottom in the early 1980s, and now sit at a market capitalization close to the internet bubble peak of 2000. Stocks appear expensive by many other measures, yet it’s possible that this pricing is rational considering very low interest rates, the potential for quantitative easing at any sign of economic weakness, and booming technology stock profits.
It’s interesting that most of the developed world’s stock markets (ex-U.S.) sit in a range of 30-70% of GDP, which is aligned with most U.S. history before the late 1990s. The previous U.S. stock market bubbles peaked at about 86% of GDP in August 1929 (ending 1929 at about 60%) and 168% of GDP in March 2000 (ending 1999 at 155%). The Japanese stock market bubble peaked at 139% of GDP in 1989 and the Chinese stock bubble peaked at about 80% of GDP in 2007.

Figure 4. U.S. Stock Market Capitalization as a percentage of GDP (as of December 31, 2019).
Figure 5 shows total debt-to-GDP for the nation since 1900. Since debt is both a liability for one, and an asset for another, Figure 5 provides a measure of the total “bond market” capitalization as a percentage of GDP. As discussed above, this measure includes U.S. government debt such as T-bills, bonds and TIPS. It consists of real estate mortgage-backed debt, state and municipal debt, as well as loans, corporate debt and more.

Figure 5. Bond and Loan Market Capitalization as a percentage of GDP (as of December 31, 2019).
Figure 6 shows residential real estate as a percentage of GDP. Typically, home prices rise with inflation over time, while the total housing stock rises with the sum of population growth and inflation, or essentially rises with GDP. Since around 1980, the residential real estate market cap has outpaced GDP, which is explained by rising land values rather than rising building costs or rapid home building.13 There’s no doubt that home price appreciation, especially on the two coasts, is supported by record-low mortgage rates, booming tech company profits, and growing wealth.
Prior to 1952, I used pointwise estimates from Goldsmith for the years of 1900, 1929, and 1945, and interpolated between these data points using population growth data and the Shiller home price index. It’s interesting that during the Great Depression, home prices fell 21% from 1929 to 1932, but not as much as nominal GDP, which fell by 46% over the same time period.
Unfortunately, I have no data for the value of commercial real estate over time. A recent estimate put it at $16 trillion at the end of 2018, compared to a $28 trillion market value for residential real estate at the time. According to Goldsmith, the value of commercial real estate was roughly the same magnitude of residential real estate over the past century.

Figure 6. Residential Real Estate as a percentage of GDP (as of December 31, 2019).
Finally, Figure 7 shows the estimated value of U.S. gold ownership over time since 1900, including U.S. central bank gold. The amount of world gold since 1900 is known reasonably well since gold production has been monitored for centuries, and essentially all gold mined is stored above ground in the form of gold bars, jewelry, and coins. There are currently about 193,000 metric tons (MT) of above-ground gold, with new supply at around 3,500 MT per year.3 Back in 1900, that figure was 28,000 MT, with new supply growing at 400 MT per year.8
As of Dec 31, 2019, the total market value of the world’s gold supply is $9.4 trillion, which dominates the market value associated with other tangible stores of value. Mixed-use industrial/monetary metals such as silver and platinum have above-ground value estimates of $50 billion and $7 billion respectively. These metals are also sensitive to economic activity, and thus have a positive correlation to equities.
Collectibles and art can also serve as stores of value, although highly-valued rarities are very sensitive to global wealth. It’s difficult to nail down a market cap for these murky markets, but it’s probably less than $1 trillion. While not tangible, bitcoin is sort of an electronic version of gold; it had a market value of $131 billion at the end of 2019.
It’s estimated that 50% of gold is in the form of jewelry, 20% in privately held coins and bars, 17% held in central bank reserves, and 13% tied up in industrial uses.4 The majority of jewelry ownership is in India and China.
Since gold is fundamentally untraceable, estimating the amount of gold in U.S. hands (government, industrial and public) requires a few assumptions to estimate ownership throughout time. For instance, in 1933 the U.S. government required private investors to turn in their gold bullion, which swelled central bank holdings. One rough approximation for the percentage of gold owned by U.S. entities is to take the U.S. GDP weight of the world’s gold supply. I’ve attempted to refine this estimate using the information in available references.3,6,7
At the end of 2019, I estimate a total U.S. ownership of 40,000 MT, or about 20% of the world’s total. We know that 8,133 MT is held by the U.S. central bank, and 1,250 mt is held in U.S. gold bullion ETFs.3 Using the above percentages, roughly 20,000 MT is held in jewelry form, 5,000 MT is tied up in industrial uses, leaving about 5,600 MT held privately in safe deposit boxes and banks in the form of coins and bars.
I’d guess that the jewelry estimate of 20,000 MT is high, while that held in bullion form is low. Still, in the U.S. over the last ten years, 600 MT of gold production went into bullion form compared to 1,200 MT for jewelry.3 Using this ratio, conceivably as much as 8,000 MT is privately held in gold coin and bar.

Figure 7. U.S.-held gold as a percentage of GDP (as of December 31, 2019).
Putting it all together, Figure 8 shows the fraction of wealth in gold versus the combined total of gold, stocks, bonds, and residential real estate. While not at the all-time lows associated with 1970 or 2000, gold ownership remains very low compared to financial asset values. Financial assets ballooned since 1981 as interest rates fell from 15% to 1%; and as shown in Table 1, financial asset growth has been strong since gold peaked in 2011. Financial assets are very over-owned compared to physical store-of-value assets.

Figure 8. U.S.-held gold market value as a fraction of the total market value of U.S. stocks, bonds, homes and gold.
As a check on the idea that U.S. institutional and private investors are heavily underweight gold, we can look at a few back-of-the-envelope checks. First, gold bullion ETFs make up only 0.25% of U.S. ETF and mutual fund assets. Adding in the 8,000 MT of gold held privately can bump this percentage up to 1.85%, but this ignores the stocks, real estate, bonds, and loans not held in mutual funds or ETFs. It’s safe to say that gold held by investors as a fraction of all U.S. financial assets is about 1% or less.
As a second check, we notice that over the past 10 years, only 5% of new gold supply in the form of jewelry, bars and coins has flowed into the U.S., with the majority going to India and China.3 In comparison to the U.S. making up 24% of world’s GDP, U.S. equities making up 58% of the MSCI All Country World Index (ACWI), and U.S. bonds making up 44% of the world’s publicly traded bond markets, we see that gold as a percentage of U.S. financial assets has been falling over the past decade.
The bottom line is that U.S. investors are massively underweight the premier tangible store-of-value asset compared to historical ownership rates over the past 120 years. The above case also supports other stores of value including bitcoin, silver, platinum, and possibly mid-priced collectibles.
Some may argue that a house is also a tangible store of value. While there are similarities, homes have significantly higher carrying costs (property taxes and upkeep) compared to gold. Residential real estate has also become more financial-like as homes are now held with debt financing and land values on the east and west coasts have risen in tandem with financial assets. When land values become a much larger portion of home prices, we expect home values to fluctuate more with the economy and wealth. A cheap house owned without debt in middle-America is the home most like a store of value asset.
Argument 2: Gold can Enhance Risk-Adjusted Returns while Providing Crisis Insurance
U.S. government bonds have long served as the safety asset class in modern portfolios. Since the Fed controls the printing press, there is no default risk associated with T-bills, T-Bonds, TIPS, and GNMAs. We expect these securities to dampen portfolio volatility and cushion equity bear markets and recessions by going up in value when stocks crash. In addition, as we extend maturities beyond T-bills, we expect a long-term annualized return premium above inflation that’s on the order of 1-2% per year.
For gold, history shows that annualized returns match inflation over the long-term, while volatility has been similar to equities since gold began to float versus the dollar in the early 1970s. Also, gold returns are fundamentally uncorrelated with stock and bond returns. Figure 9 shows how adding 10% gold (from bonds) affects portfolio expected returns in the nominal case. Each dot represents a 10% equity allocation increment from 0% to 100% as we increase portfolio risk. I’ve used three ETFs for this illustration, with all return assumptions in the box below the curve, including an assumption that the inflation rate is 2% per year. The return and standard deviation information included is for illustrative purposes only and does not represent actual performance results.
Adding gold reduces risk-adjusted returns except at very low equity-bond splits. One way to view the reduction of returns per unit of risk is that this is the cost of unexpected inflation/financial catastrophe insurance that gold provides.

Figure 9: The hypothetical impact of adding 10% gold (from bonds) to portfolios of various equity-bond splits in a normal investing environment.*
What’s different now? Future government bond returns will be a far cry from those associated with the last 40 years. TIPS breakeven yields suggest flat to negative real interest rates out to 20 years. Economies around the world are highly sensitive to higher interest rates. As soon as rates rise, economic growth slows, thus sowing the seeds for future rate declines. In addition, central banks are highly motivated to keep interest rates below the inflation rate to help reduce debt levels over time.
What are the portfolio implications? First, over the next decade, we expect government bonds to provide future returns that are below inflation rates on the short end, and matching inflation on the long end. Figure 10 shows this case simply by changing the bond return assumption to match inflation before fees. We continue to assume that gold will provide inflation-matching returns. Adding a 10% allocation to gold now enhances portfolio risk-adjusted returns even though the bond ETF slightly outperforms the gold ETF net of fees.
Adding gold, and the insurance it provides, no longer penalizes portfolio risk-adjusted returns. Gold ETFs provide an excellent way to gain exposure at low fees (18 bps), no storage or insurance costs, and ownership in tax-deferred accounts to avoid the collectibles tax rate.
In addition to enhancing risk-adjusted returns, gold provides solid insurance for many tail-risk scenarios, including an unexpected inflation spike, currency and trade wars, political chaos and hot wars, increased corporate tax rates, recessions risk, default risk, negative interest rates, and money printing. With debt-to-GDP levels and wealth inequality so high, this insurance seems needed more than ever.
 Figure 10: The hypothetical impact of adding 10% gold (from bonds) to portfolios of various equity-bond splits with the assumption that bonds deliver returns that match inflation.*
Another potential source of funding for a gold allocation is from the alternatives camp. This class of investment strategies include hedge funds, liquid alternatives funds, managed futures, and commodity funds. These alternatives have a number of issues that have led to generally poor performance over the past 10+ years.14,15
In an environment of financial repression, expect alternatives to struggle for a few reasons. First, the returns associated with these strategies are fundamentally linked to T-bill returns, which are often used as collateral for much of the portfolio. If short rates are held below inflation over the next decade, expect gold to perform well comparatively.
Second, these strategies have high fees and are generally crowded with too much assets. This leads to poor aggregate returns for everyone. For those strategies fundamentally uncorrelated with stocks and bonds, like commodity and managed-futures funds, expect returns to be close to T-bills minus fees. For strategies that have some correlation with equities and credit (most hedge funds), expect diminished portfolio diversification benefits. In other words, replacing bonds with hedge funds will provide a similar risk-adjusted return as simply raising equity exposure slightly. Another issue is what kind of losses will we see during the next financial crisis? Will hedge funds repeat their 6-sigma epic fail when stocks crashed in 2008-2009?
Of course, if you can find the outperforming alternatives and hedge funds, then there’s plenty of benefit for the portfolio. Even so, it’s worth considering a partial shift of the alternative’s allocation into gold.
Additional Thoughts as a Trader
Gold appears to deserve a much larger allocation to pension fund and individual investor portfolios. We don’t need inflation to rise above 2% for this allocation to work.
Investors need to shake their views that gold is only useful as an end-of-the-world anarchy hedge satisfied by gold coins in a safe deposit box. Gold deserves a role in modern portfolios with a position size that will make a difference. A 5% allocation makes sense.
I expect investors to be very slow to incorporate this view. Professional investors, either investment advisors or pension fund managers, have little interest in gold for most likely irrational reasons – it’s an unconventional view, inflation remains subdued, there’s little client interest, career risk mitigation, or perhaps from being burned by the last time they recommended gold to clients a decade ago.
Figure 11 shows a hypothetical case where equity returns are reduced (in-line with many expert opinions) and gold providing equity-like returns, assuming gold is repriced to higher values as more and more investors adopt a gold allocation in their portfolio. Adding gold with this upside scenario is very attractive.
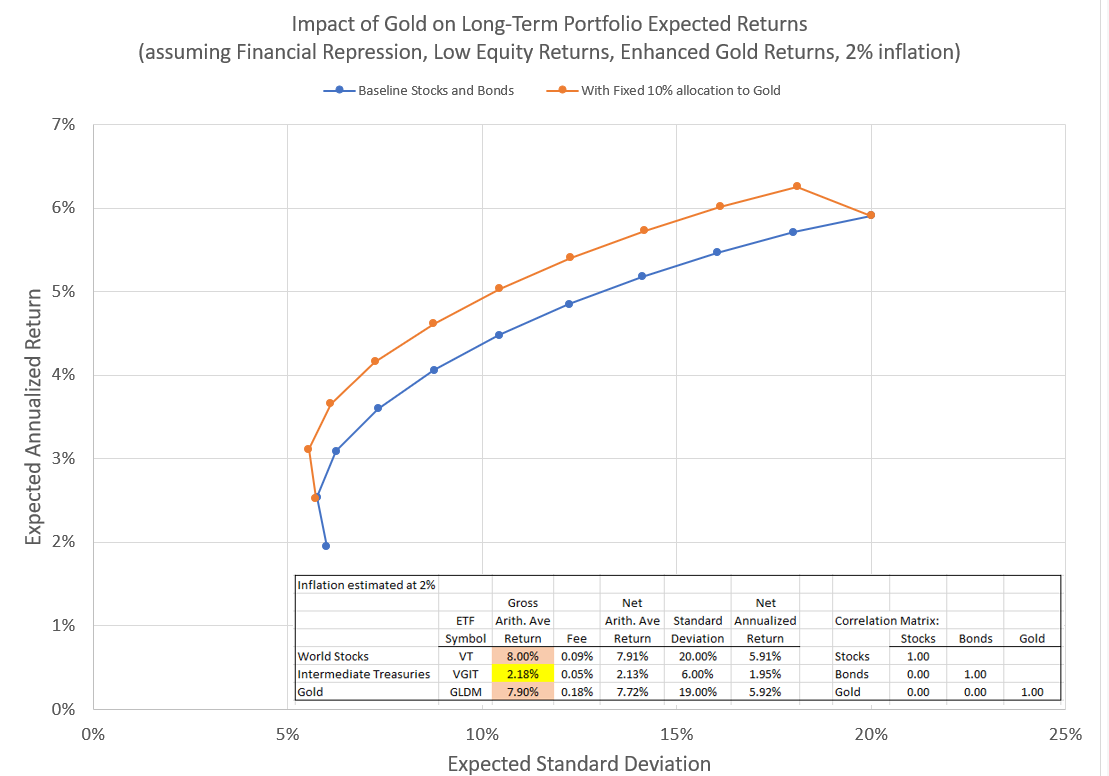
Figure 11: The hypothetical impact of adding 10% gold (from bonds) to portfolios of various equity-bond splits under the assumption that gold provides equity-like returns.*
Lastly, we notice that gold is acting very well right now. Gold is moving up and down with treasuries, which are moving inversely with equities. When equities fall, due to poor economic news or recently due to the coronavirus outbreak, treasuries and gold go up in value. On positive economic news, equities rise in value, while bonds and gold sell off. Gold has been basing for 8 years, while U.S. financial assets have been the star performers.
In addition, gold is providing an excellent long-term tell. As the dollar has continued to rise during the past year, gold has also experienced a strong uptrend, even in the face of strong equity returns over the past year. This is not supposed to happen, and this sort of tell is a good sign for future rising prices.
Conclusions
I write this blog post as an asset allocator and investor. I’m not a “gold bug” and I’m not predicting any sort of world catastrophe. I don’t think we should go back to the gold standard; indeed, I think floating currencies have played a role in making markets and economies safer over the past 50 years.
My general view is that gold does not belong in a long-term investment portfolio because historically returns have just matched inflation. We want only inflation-beating asset classes in our portfolios. This is the conventional view of most investment professionals, and for that reason, gold is significantly under-owned.
Yet now, gold makes sense with bond yields so low. It seems very reasonable to bet that interest rates will remain below inflation over the next decade. Gold is breaking out of a 8-year consolidation period. It’s acting very strong while the U.S. dollar and stock market has risen over the past year.
Black swan risks seem heightened and it’s been ten years since the last recession. The opportunity cost associated with owning gold, rebalancing periodically to dampen the volatility, appear to be very low, perhaps even negative. Bitcoin, platinum, silver, and collectibles may also make sense at this time, but gold remains the most liquid and premier store-of-value asset. Gold deserves an allocation in modern investment portfolios.
References
- Dalio, R., Principles for Navigating Big Debt Crises, November 2018.
- Dalio, R., “Populism: The Phenomenon”, Bridgewater Daily Note, March 22, 2017.
- World Gold Council, https://www.gold.org/.
- Callaway, G. and Ramsbottom, O., “Can the gold industry return to the golden age: Digging for a solution to the gold mining reserve crisis”, McKinsey & Company, April 2019.
- Congressional Budget Office Report, “The Budget and Economic Outlook: 2020 to 2030, January 28, 2020. https://www.cbo.gov/publication/56020.
- Goldsmith, R., Comparative National Balance Sheets – A Study of Twenty Countries, 1688-1978, 1985.
- Green, T., “Central Bank Gold Reserves: An historical perspective since 1845, World Gold Council Research Study No. 23, November 1999.
- S. Geological Society National Minerals Information Center, https://www.usgs.gov/centers/nmic.
- The World Bank, https://data.worldbank.org/.
- Our World in Data, https://ourworldindata.org/.
- Ned Davis Research, https://www.ndr.com/.
- Vague, R., “The Private Debt Crisis”, Fall 2016, https://democracyjournal.org/magazine/42/the-private-debt-crisis/.
- Knoll, K., Schularick, M., Steger, T., “No Price Like Home: Global House Prices, 1870-2012”, Federal Reserve Bank of Dallas, Working Paper No. 208, October 2014.
- Tilley, D.L., “Asset Class of Trading Strategy?”, Asset Class Trading, July 13, 2015.
- Tilley, D.L., “Why we still don’t favor commodities”, February 14, 2008. https://www.merriman.com/advanced-portfolio-management/why-we-still-dont-favor-commodities/.
Disclosure
*The return and standard deviation information included in Figures 9, 10, and 11 is for illustrative purposes only and does not represent actual performance information.
Past performance shown in other figures and tables (such as Table 1 and Figure 1) is not indicative of future results. The content contained within this blog reflects the personal views and opinions of Dennis Tilley, and not necessarily those of Merriman Wealth Management, LLC. This website is for educational and/or entertainment purposes only. Use this information at your own risk, and the content should not be considered legal, tax or investment advice. The reader should consult with a financial services professional regarding the suitability of gold in their own investment portfolio
The views contained in this blog may change at any time without notice, and may be inappropriate for an individual’s investment portfolio. There is no guarantee that securities and/or the techniques mentioned in this blog will make money or enhance risk-adjusted returns. The information contained in this blog may use views, estimates, assumptions, facts and information from other sources that are believed to be accurate and reliable as of the date of each blog entry. The content provided within this blog is the property of Dennis Tilley & Merriman Wealth Management, LLC (“Merriman”). For more details, see the Important Disclosure.