
 An essential component of successful trading is having a good sense of timing. The standard industry tool for getting the timing right is technical analysis, so we need to examine its effectiveness. I’ll assume the reader is familiar with technical analysis, and as an asset class trader, I’ll also assume we control a limited amount of assets such that positions can be bought and liquidated with minimal trading impact costs.
For extremely large asset management firms and hedge funds, technical analysis is not an available tool because all-in trading costs are prohibitively expensive with this approach. These firms are forced to use other approaches such as value investing, which is, ironically, a horrible tool for timing price moves. Even large trend following CTAs are forced to use the most liquid futures contracts to minimize trading impact costs. So perhaps being small and using technical analysis is an advantage for us.
In a nutshell, technical analysis is the analysis of price and trading volume patterns to identify current and future price uptrends, downtrends and trend turning points. Practically all trading “how-to” books rely almost exclusively on technical analysis. Technical analysis techniques and patterns appear to be valid on all time scales and with any tradable security.
I gravitated to TA rather quickly when I first started trading, because as a full-time engineer, trading was a hobby. I didn’t have the time or expertise to dig through how the “fundamentals” influenced prices. I read many books on technical analysis and trading. The classic books are still the best,1-4 while most others fail to provide additional insight. In the next few blog posts I’ll talk about technical analysis, trend following and backtesting issues associated with mechanical trading models. Nowadays, I still look at charts and use basic technical analysis, but I don’t expect too much from it.
Data Set
The data set consists of price and volume data for all securities currently trading and all those traded in the past. It’s a daunting amount of data to deal with, but certainly a playground for people who love looking at data for patterns. For each security’s historical price and volume data, we can apply a myriad of techniques, indicators and mathematical manipulations on many different time scales to search for approaches to predict future price movements.
TA approaches can span from practical (for example, moving averages and channel breakouts), to various mathematical derivatives of price data (such as oscillators, stochastics, and Bollinger Bands), to controversial price pattern approaches (for example, Elliott Wave, Fibonacci patterns, and Gann angles).
In addition, combining price data among many securities creates additional combinations to be analyzed in search for a trading edge. Here are the primary types:
- Relative Strength (RS) line – Important with pair trades. The RS line is formed by dividing (one plus the return) of one security over a period of time versus (one plus return) for another security – often a benchmark like the S&P 500, the MSCI ACWI or Barclays Aggregate Bond Index. I highlighted the RS line in various charts in previous posts.
- Momentum – The ranking of many securities, or asset classes, based on recent 6 to 12 month performance. This will be the subject of a future blog.
- Breadth – This measures the extent to which all securities are moving in synch with each other or not. An example indicator is the percentage of stocks above their 50-day moving average.
Also, technical analysts incorporate many other pieces of information to improve the predictability of forecasts, such as sentiment survey information, seasonal patterns and Fed policy. In this blog, I want to consider only price and volume data and whether there’s alpha to be found in the manipulation of such data.
The human mind is very adept at finding patterns among data that is mostly random.5 Traders are also attracted to indicators and trading approaches that have worked recently (such as during the past year), and TA offers hundreds of indicators that fit those criteria at any given moment. It’s also very easy to spend valuable time investigating new and alluring technical indicators. For these reasons, and since few things about the markets can be proven scientifically, we need to use logic and common sense to judge whether TA can provide a trading edge.
Technical Analysis Issues
I have four issues with technical analysis.
Ask the Right Question: What Is the Definition of Working?
Most trading books equate making money with working, but that’s not the proper definition of “working.” In a bull market, any trading system or TA approach will make money. As I explained in Finding an Edge, we must compare the risk-adjusted returns of our trading portfolio or trading system with that associated with an appropriate benchmark. If price patterns are used to pick stocks, then the Russell 2000 or S&P 500 is an appropriate benchmark. As an asset class trader, the MSCI ACWI may be better. If a trading approach using TA is discretionary, then keep track of results and compare them with a benchmark over time.
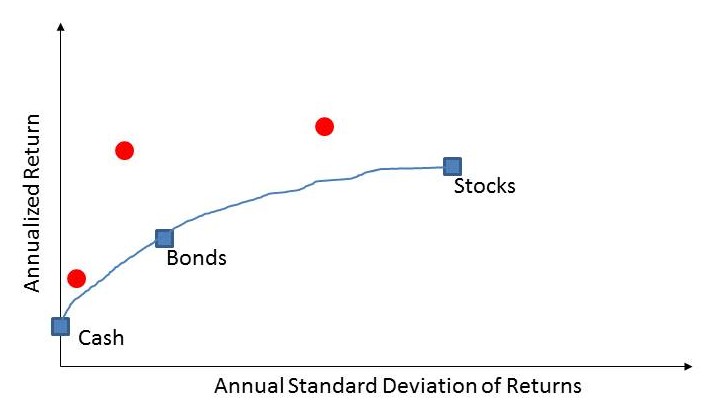
In Figure 1 three hypothetical return-risk data points are shown that would imply value-added trading. To demonstrate a trading edge associated with a TA approach, a trader must show long-term, real-time performance that’s above the cash-bond-stock line. Unfortunately, we need many years of data to make a final judgment of value-add, although this can be shortened the better the performance. Luck plays too large a role over a period of a year or two.
So the question remains, does technical analysis provide ways to generate enhanced risk-adjusted returns compared to benchmarks?
Figure 1. Examples of return-risk characteristics that demonstrate alpha generation
Backtesting Issues
Since long-term, real-time trading results are very difficult to find, the next best approach is to backtest technical indicators and trading rules with historical data. Any set of rules can easily be programmed into a computer and thus tested. With the enormous amount of price/volume data, finding mechanical trading rules that would have worked in the past is not that difficult.
Unencumbered by any sort of experience in the investing field, I began my new career by performing detailed studies to determine if mechanical trend-following system performance could be optimized, or if one indicator was best. For example, is an exponential moving average better than a simple moving average? The answer on all fronts was no, and it became obvious that this wasn’t the right question to ask.
Since then, I’ve backtested a myriad of trading approaches rooted in a variety of technical analysis indicators. For the most liquid markets, such as the S&P 500, I’ve never found a price-only backtested technical system that enhanced risk-adjusted returns in real-time trading.
There are a lot of nuances and traps associated with backtesting that I’ll leave for a future blog. Here are seven typical concerns when I see promised alpha associated with backtested results.
- Optimizing parameters to show superior backtested results. Relying on any form of optimization does not work in real time.
- In the asset class trading space, sometimes you’ll see “promising” backtested studies that use untradable market indices. Once a market index goes from theoretical to tradable, its character changes, stale price effects are eliminated and trading systems trained on this artificial data ultimately fail to deliver value in real time.
- For individual stocks or fund selection techniques, not accounting for survivorship bias can taint results.
- Too short of a time frame usually caused by the lack of data. If a backtested trading approach shows great results during a quiescent time period or a secular bull market, then the system will likely be unadaptable to a regime shift in market character. One the flip side, backtested success may be due to a once-in-a-generation event such as the 1987 crash, the 1995 to 1999 NASDAQ bubble or the extreme volatility associated with the 2008 to 2009 financial crisis.
- The lack of a good explanation for why an indicator should work, or who or what is being exploited by the trading approach.
- Using today’s trading costs and liquidity applied to yesterday’s markets. This is equivalent to having a trading edge in the old days where you have low trading costs and everyone else has high costs. Of course you’d expect superior results from backtesting with old data.
- Finally, with so much data, and infinite attempts to manipulate and test the data, you’d expect the risk of finding patterns in random data would be high. Testers try to minimize this possibility with out-of-sample testing, but this precaution is not effective when someone has a lifetime to search the data for trading edges.
I’ve essentially given up on backtesting price/volume data in the search for trading edges. While there’s no way to prove conclusively that TA does not add value, at least on the backtesting front, I have yet to find evidence that it does in my 15+ years of searching for trading edges. For less liquid markets, perhaps TA can add value, but only because the trading discipline systematically exploits a different trading edge (such as stale pricing).
Over the years I’ve seen fresh articles and indicators that have intrigued me, and I’ve gotten sucked back into the price and volume alpha hunt, only to be reeducated in the view that this isn’t a place to look for alpha. Now I’ve become highly cynical about the potential success of any new trading indicator.
No Barrier to Entry
The paradox associated with TA, and any alpha-generating approach for that matter, is that I have no doubt technical analysis would be extremely effective if few people did it. Unfortunately, this is not the case.
There is an enormous amount of money implementing mechanical trend-following approaches in the futures markets. Common users of TA at the institutional level include CTAs, managed futures funds and global macro funds. These organizations manage hundreds of billions of dollars and often employ Ph.D.’s in mathematics and the sciences to hunt for pricing edges. For small scale trading, there is a huge number of traders implementing TA approaches.
The essence of technical analysis is to provide the timing for when to transact a security. Technical analysis is by definition a liquidity demanding strategy, and therefore a low capacity approach. It doesn’t take many traders to follow a trading signal, push up prices for all (for buy-signals) and significantly hurt prices for all (on sell signals) to cause an approach to lose its long-term effectiveness.
With computing power these days, there are no barriers to backtesting trading approaches. Data is essentially free. It would be too easy if this approach worked. Common sense suggests that no barrier to entry is equivalent to no trading edge. Fellow traders will eventually jump on any new and innovative approach to adding value using price/volume data. New hedge and mutual funds will be developed to exploit the edge, all acting on similar timing signals that ultimately move the markets to the point where the edge has been eliminated. I wonder if this will be the fate of the various short-volatility funds currently being sold to investors.
Motivations
I stopped reading TA books about 10 years ago. There is a semi-large industry built around technical analysis. Some authors support themselves by writing books on technical analysis and speaking at trading conferences. The Market Technicians Association sponsors a three-test Chartered Market Technician designation that’s similar to the Chartered Financial Analyst (CFA) designation. Brokerages, active trading platforms and charting software packages provide a myriad of technical analysis indicators to imply that trading can be mastered by the detailed study of these tools.
We can’t rely on these people, who are experts in their field, to provide an unbiased assessment of whether TA works. Admitting there is no value in using these tools is bad for business. So we must take what they say with a sizable grain of salt, which is pretty much the case when listening to any financial product sales pitch. Common sense suggests that if the trading approach is really that great, they wouldn’t be selling it – they’d be using it.
In addition, bona fides must be considered with skepticism. Past work for a famous hedge fund doesn’t mean they ever added value with TA there. Past work managing a small hedge fund or as a proprietary trader doesn’t mean they successfully used TA. It’s relatively easy to open a small hedge fund with $500,000. By the way, I wouldn’t doubt that some hedge fund greats don’t mind using TA as a cover for what they’re really doing to add value.
Counterargument
Technical analysts have heard all of these complaints before, and have a number of weak counterarguments. They at times counter that successful technical analysis has an element of art along with the science. I’m actually partial to this view because we know from experience that in any field, some people are just naturally more talented or gifted in their work.
Technical analysis can provide a framework for developing a sixth sense for the market through years of practice. I’m fine with that argument also, but we need to reclassify things – the trading edge is the sixth sense, while technical analysis is the investment discipline.
Technical analysts may also claim that to be successful, a nuanced view is required, or the analyst needs to incorporate a weight of the evidence approach using other information, such as seasonality, sentiment and central bank policy, to successfully interpret technical signals. Again, the nuance view and the additional information is the edge, and technical analysis is the discipline.
As I described in Finding an Edge, investment disciplines do not generate alpha.
Takeaways
It’s impossible to prove anything associated with the financial markets, and that includes proving whether technical analysis works. In my opinion, combing through price and volume data is not a good place to look for trading edges.
There is no evidence that technical analysis enhances risk-adjusted returns over the long term, at least if standard deviation is used as the risk measure. Looking forward, there’s no barrier to entry in implementing a mechanical TA approach. Data and computing power are extremely cheap. Any successful system will be quickly arbitraged away, especially since TA is inherently capacity constrained.
However, that doesn’t mean technical analysis isn’t useful. TA is an investment discipline, not a trading edge. Depending on the approach (trend following or counter-trend trading), TA changes the distribution of returns. The essence of trend following is letting profits run, and cutting losses short can be a nice psychological fit for many traders and investors. Technical analysis can be used as a framework for viewing market action, incorporating feedback and searching for trading edges. In the next blog, I’ll discuss this aspect of trend following in great detail.
Read a few books to understand the gist of the technical analysis approaches. Technical analysis, trend following in particular, is used heavily in the markets. Keep it simple – you should be able to look at a chart and visually identify the current trend on any time scale. I use a simple peak-valley approach. Likewise, you should understand the basics of how to mechanically identify the trend with moving averages, channel breakouts, etc. Here again, there is no need to develop complex mathematical indicators. Keeping it simple is best.
Don’t get sucked into the backtesting morass of finding optimum look back periods, optimizing systems, using complex mathematical derivatives of price data. Don’t get lured by mysterious technical indicators or magical new ways to trade the markets. Remember the motivations of the individuals who develop these systems – it’s to sell their products, not make you money.
Anyone who claims to successfully trade with technical analysis should be judged with skepticism. Perhaps the success was due to good luck over a short time period (1 to 2 years). If there is long-term success, then I’d expect the trader is unknowingly exploiting a different edge or has a special unteachable knack for this sort of trading (which is an edge), or is effectively using additional information. For myself, I would feel extremely hamstrung to deliver alpha if all I had was price and volume data.
References
- Pring, M.J., Technical Analysis Explained: The Successful Investor’s Guide to Spotting Investment Trends and Turning Points, 5th edition, 2014.
- Edwards, R.D. and McGee, J., Technical Analysis of Stock Trends, 2011 reprint of 1958 4th
- Murphy, J.J., Technical Analysis of the Financial Markets: A Comprehensive Guide to Trading Methods and Applications, 1999.
- Schwager, J.D., Schwager on Futures: Technical Analysis, 1995.
- Aronson, D., Evidence-Based Technical Analysis: Applying the Scientific Method and Statistical inference to Trading Signals, Chapter 2, 2006.
Disclosure
The content contained within this blog reflects the personal views and opinions of Dennis Tilley, and not necessarily those of Merriman Wealth Management, LLC. This website is for educational and/or entertainment purposes only. Use this information at your own risk, and the content should not be considered legal, tax or investment advice. The views contained in this blog may change at any time without notice, and may be inappropriate for an individual’s investment portfolio. There is no guarantee that securities and/or the techniques mentioned in this blog will make money or enhance risk-adjusted returns. The information contained in this blog may use views, estimates, assumptions, facts and information from other sources that are believed to be accurate and reliable as of the date of each blog entry. The content provided within this blog is the property of Dennis Tilley & Merriman Wealth Management, LLC (“Merriman”). For more details, please consult the Important Disclosure link here.