
 If you’re in the investment biz long enough, you’ll inevitably find yourselves searching for profitable ideas when an asset class is experiencing a bubble. The term “bubble” is a heavily overused term in the financial media and among professional investors. Any large price increase over a short time period, such as a 50% gain over a year, prompts a few writers, analysts or professional investors to describe the runup as a bubble. These bearish folks are typically using the term loosely without a nuanced evaluation to determine if prices have simply reflected new highly positive information.
Additionally, how many times have we heard “bubble” used for assets that have experienced long-term, secular bull markets, such as U.S. or Japanese government bonds, when current prices are not experiencing anything like the bubble phenomenon? Then other folks use the term in a variety of ways to describe investor group think, such as “hedge funds are the next investment bubble,” or “there’s currently a bubble in investor complacency.”
I’m specifically interested in those moments in time, which can last months or even years, when price-insensitive buyers become ever more attracted to rapidly rising prices, thus bidding an asset class price way above fair value. It’s a time when pricing is determined by the one-way thinking associated with the “madness of crowds,” rather than the normal, efficient markets “wisdom of crowds” effect. The massive number of performance chasers overwhelms the financial resources of professional investors and traders attempting to push prices back to fair value by shorting and selling the asset class.
Even though the gap between price and fair value grows ever larger, uncertainty about when the market will top and how much further the price will rise creates a situation where the risk-reward of shorting the asset class becomes very unattractive. The arbs, who are usually pushing prices back to fair value, then step away, or perhaps even join the crowd. Other opportunistic professional investors join the crowd by creating new products and/or new firms to exploit the attractive optionality associated with easy money raising and rapidly rising prices.
Bubbles have occurred about once a generation throughout human history, as new investors enter the market with no experience with how bubbles eventually burst. Examples of the large bubbles include the NASDAQ bubble in the late 1990s and the Japanese stock market bubble in the late 1980s. The current bitcoin and cryptocurrency craze has all the attributes of a bubble.
Many Rapid Price Increases Are Not Bubbles
Just because an asset class has a large and rapid price run doesn’t mean it’s mispriced. One or two U.S. industry groups often have a yearly gain of greater than 50%. Most often, prices have increased to reflect unexpected improved future earnings. Also, most bull market tops don’t have a bubble associated with prices. The topping process is more drawn out as the collective wisdom is formed by market players generally using reasonable judgment of future prospects. Prices ultimately collapse when investors sense an emerging bear market or recession.
Eugene Fama, the Nobel-Prize-winning champion of the efficient markets view, believes there is no such thing as bubbles. Bubbles are only known after the fact, when there’s been a large collapse. Careful analysis of large price increases shows that many, perhaps even half, are never followed by a collapse.1 Simple price formulas for defining a bubble, even the approach used by the famous bubble studiers GMO,2,3 are not enough. We need more information.
Greenwood, Shleifer, and You recently published an excellent working paper on this subject titled Bubbles for Fama.1 All asset class traders should study this paper to gain an appreciation for the statistical properties of future returns after an asset class doubles over a short time frame. While the probability of a price collapse is elevated, many asset classes never crash and often continue to outperform the market afterwards.
The obvious reason for a price spike is that the market is attempting to discount an emerging, compelling growth story with rapidly rising prices. After that, future returns can do a few things. If the sector becomes a market performer, then the market did its job to equalize risk-adjusted returns among all securities. The rapidly rising asset class can also continue to outperform the market for a few additional years.
Alternatively, the growth story can greatly disappoint when new competitors or new technology enters the mix, and prices ultimately collapse. Such developments do occur, and many investors incorrectly view the rise and fall as an irrational bubble. Ex-post, investors look foolish. Ex-ante, prices were reasonable given the information at hand. While there was probably some element of speculation in the price, there could be no reasonable view that prices were grossly mispriced along the way.
Practically all commodity price spikes associated with supply or demand shocks are not bubbles, even if prices subsequently fall. In 1990, oil prices rose from $18 a barrel mid-year to $40 a barrel in October when Iraq invaded Kuwait. By the time the coalition aerial bombing campaign began on January 16, 1991, prices had fallen back to pre-war levels. While the price action may have looked irrational and bubble-like, there was no instance during the rise and fall that we could make an educated guess that prices were grossly mispriced. Instead, prices were simply reflecting new and rapidly changing information. Many past commodity spikes were not bubbles, even if some have called them bubbles – nickel in 1987, sugar in 1975 and uranium in 2007 are a few examples.
Short squeezes are another sharp price rise followed by a collapse. Short squeezes result from panic buying by short sellers scrambling to limit losses, which does indeed push prices above fair value and has a parabolic price rise associated with it. But a short squeeze is not a bubble. Likewise, market manipulation activities that push prices way above fair value, such as the corners attempted by the robber barons in the late 1800s, are not bubbles.
Finally, a decade-long bull market in stocks, bonds or a major currency does not mean the asset class is experiencing a bubble. After such a long run, the asset class may be overvalued compared to other asset classes or compared to historical measures. But this is simply the case of an expensive asset class with reduced expected returns, not a bubble. Often, there are rational reasons for why an asset class is valued richly, and there is no catalyst for a return to “normal” valuations. To contrast, the existence of a bubble typically provides a near-term catalyst for upcoming asset class trend changes.
Ten Attributes of a Bubble
There’s much more to a bubble than a rapid price increase. To identify bubble behavior, we need to put ourselves in the heads of the market players at the time.
What distinguishes a bubble from a market that’s simply pricing in a new growth story? Both events have a large runup in prices. What distinguishes a bubble from a normal economic boom and bust cycle? Both have elements of excessive leverage, high valuations, increased IPO activity, retail public interest and optimism. Yet, most bear markets are completely unpredictable. Bubbles represent the most extreme of procyclical behavior in the markets. When an asset class is clearly in bubble territory, then we can expect that prices are well above fair value and that the end is near – which may serve as a catalyst for upcoming major asset class turning points.
Let’s look at history as a guide. Below are 10 bubble attributes we can use to assess the extent that prices may be exhibiting bubble-like behavior. Good asset class trading is all about making educated guesses. By evaluating the quantity and severity of bubble attributes listed below, we can assess the likelihood that a bubble is in the works.
- Heavy retail investor involvement
This is an essential element. Retail investors can be a powerful driving force on prices when their views are all in sync with each other. Retail investors are often new to investing, generally unsophisticated, have never experienced a bubble, are price-insensitive, tend to chase returns, and can be gullible, believing that compelling growth stories never end. They have no sense of market history, or how future competition hurts profits, and do not understand the market’s discounting mechanism.
Few professional and institutional investors chase rapidly rising prices. A large industry group move, such as a double in two years, that has little retail investor involvement is likely to be an appropriate repricing of future earnings. Since the price rise is due to the collective actions of professionals, it’s not a bubble.
Bubble investors also tend to be young, with much less to lose than older investors or professional investors. Bubble assets may also be purchased as a form of gambling entertainment and fun, with no return expectations. Only retail investors buy assets for this reason.
Foreign investors can also provide fuel for a bubble if they are flush with riches, or if they themselves are retail investors or price-insensitive buyers. Investors naturally rely much more on price action when investing in foreign markets because they’re not immersed in the culture, politics and economic history of faraway lands and know few people who live there. Foreign investors often need a compelling growth story just to consider investing in a foreign asset, and then may buy sight unseen if they think they can profitably sell the asset later to another investor based in their own country.
- New-era thinking
Bubbles need a compelling growth story to allow investors to justify buying at any price.4,5 Something new is required to capture the imagination of investors and attract people who don’t usually invest. Typical new-era thinking involves technological innovations, financial innovations and new eras of prosperity.
New technologies, such as the introduction of canals, railroads, automobiles, the telephone and the internet have indeed been life changing and positive innovations. Yet, excitement drives prices way above what is rational. Canals sparked the birth of Chicago in the 1830s and railroads set in motion the rapid growth of Los Angeles in the 1880s. Both innovations fueled land bubbles.
Financial innovations are hit and miss. New asset classes, such as tulips and Beanie Babies, were misses. Although certainly true in general, mass adoption of “stocks for the long run” prompted investors to buy equities at any price in 1929 and 1999. The introduction of commodity funds as a way to generate equity-like returns with no correlation to stocks and bonds partially drove the oil bubble that peaked in 2007.
Bubbles fueled by new eras of economic prosperity, often after a decade or more of growth, always end badly. Economic prosperity and new-era thinking fueled the Japanese bubble in the late 1980s, the Kuwaiti equity bubble in the early 1980s, the Chinese equity bubble in the mid-2000s, and the 1929 and 2000 U.S. equity bubbles. Likewise, bubbles associated with emerging market growth stories generally end badly.
The current bitcoin and cryptocurrency craze is based on the combination of technological (blockchain) and financial innovation (digital assets and digital money).
There are also a few bubbles, or bubble-like runups, associated with oil and gold prices. New-era thinking doesn’t stem from excessive optimism – it resides in the fear column. The fear of high inflation drove gold prices in the late 1970s, and the fear of running out of oil drove price runs in the early 1980s and mid-2000s.
- Irrational valuations
The bubbly asset class will be very overvalued, perhaps even absurdly overvalued, when using common sense. A tulip priced at five years’ worth of wages seems absurd, but that’s what happened in the Dutch Republic during the 1630s.6 Japanese real estate valued at 4x U.S. real estate seems absurd.6 In the late 1980s, the Japanese stock market traded at a 50 price-to-earnings multiple based on peak earnings. The NASDAQ market traded at the same 50 multiple based on peak earnings in the late 1990s. Melbourne land prices in 1891 were valued higher than London land prices with only a tenth the population.7,8
With new asset classes and new industries, assessing overvaluation is difficult because there’s no historical reference. What is the rational cryptocurrency market cap? How much should a rare, mint-condition, 1952 Topps Mickey Mantle baseball card be worth? Sometimes, the state of overvaluation is known only after the fact because it’s hard at the time to assess valuations given the growth prospects. Academics have tried to rationalize prices paid during bubbles using valuation models with very rosy assumptions, imbedded options and comps.
Often, people come up with new rationales to justify high prices, such as the ubiquitous “this time is different” economic scenarios. Another example is when enthusiasts used price per clicks to evaluate internet stocks when all companies were burning through cash. At other times, values are justified by a view that the government won’t let prices fall too much.
Not every bubble will have this attribute for the market as a whole. Sometimes the craziness is seen at the individual security level. Upstart internet firm eToys was valued higher than Toys “R” Us in 1999 while having 400x less sales.4 Funds of bubble assets can trade at huge premiums. Stocks only peripherally involved in the bubble industry, with a tiny fraction of sales associated with the bubble industry, can be bid up well above fair value. Low-priced peripheral assets can be bid up beyond fair value due to an affordability benefit for millions of enthusiastic retail investors with limited funds.
Another aspect of irrational pricing is when investors fail to look ahead and see that competition among the many ventures and the excessive flow of money into the asset class will hurt future returns for all. Investors fail to logically see that most ventures will fail and it’s very difficult to predict at the time who the winners will be. Competition among the survivors will likely kill margins and profits. When ten railroads are proposed for the same route, all with subscriptions trading at a premium, and only one will receive a concession, then irrational crowd pricing is in action.6
- Five or more years of swiftly rising prices
A prelude to the final bubble blow-off top is a long period of prices rising at an unsustainable rate, such that past bear markets are a distant memory and new investors only know a market that goes up. A rate of rise that’s double the historical long-term rate of return over five or so years will suffice. For equities, that’s about 20% per year. For residential real estate or land values, a rate of return of 5-10% per year for at least a five-year period can establish a get-rich quick mentality and attract new investors since leverage can produce very high net returns.
- Parabolic rise in price
This is another very important criterion signaling the end is near (within a year or so). This is essentially a parabolic blow-off top. After such a long period of excellent returns, the rate of price growth accelerates, suggesting that investors are panic buying for fear of missing out, short sellers (if there are any left) are rapidly covering their shorts, and the last potential buyers (or doubters) are finally capitulating and buying.
On a side note, I generally sell any parabolic price increase on any time scale, and I’m attracted to any asset class that’s experienced a parabolic price drop on any time scale. In the study of industry bubbles, Greenwood, Shleifer, and You show that the larger the parabolic runup, the more likely prices will be lower in the next one and two years, and the higher the probability of a 40%+ crash.1
- Shorting is unattractive or impossible
Bubbles are moments in time when retail investor buying overwhelms the grand total of professional investor capacity to force prices back to fair value. Many bubbles occur in markets where short selling is impossible or not allowed. There was no way to short the Beanie Baby bubble9 or the various land bubbles.
Even when shorting is an available tool, there’s a lot of risk in attempting to short a bubble because we don’t know when the bubble will burst, how much higher prices will go, or how many price-insensitive buyers will enter the market. Shorting can gain 100% at best and less considering costs, fortitude and stop-losses. Meanwhile, losses can be multiples of that during a mania. Last year bitcoin was up 14x. Bitcoin is so volatile that shorting is highly risky. With respect to costs, borrow rates for some of the sketchy blockchain stocks were greater than 100% per year in January 2018. That can really eat into gains associated with shorting. The best move for professional traders is likely to step away from the market until the bubble has obviously busted. This leaves fewer professionals to push prices to fair value.
Finally, if a bubble is occurring in a benchmark asset class, such as with the U.S. stock market, then career risk can play a major role in the mentality of professional investors. Selling the entire stock market and sitting in cash will lead to a significant loss of assets since customers will likely feel that the portfolio manager just doesn’t get it. Since calling the top is so difficult and the risk of job loss associated with significant underperformance is likely, most professionals feel they have no choice but to ride the wave up and then back down.
- Social mania
Bubbles are a social mania. Everyone is talking about it – the news media, comedians and friends. Account openings skyrocket, mostly by people with little investment experience. The innate human instinct to stick with the crowd is irresistible. There’s an acute fear of missing out on the fun, and envy and admiration for the few that got in early. Standing out from the crowd and not “getting it” is socially unacceptable. It seems that everyone is euphoric and getting rich with little effort. Advertisements for get-rich quick schemes emerge, trade magazines and websites associated with the phenomenon sprout up. Perhaps a firm associated with the bubble is advertising nationally. New words and references associated with the bubble are introduced and adopted in the nation’s lexicon.
- Product providers exploit excessive demand
Due to excessive demand for bubble assets and various purchase limitations, any security remotely related to the phenomenon is often bid up in price. One simple purchase limitation during bubbles is price level, which can inhibit small investors from using small amounts of money to gamble on the craze. For instance, during the baseball card bubble of the 1980s, few collectors could afford the $2,500 price for a 1952 Topps rookie Mickey Mantle baseball card, but many newly formed companies mass produced newer rookie cards that were very affordable.
The difficulty in trading cryptocurrencies from standard brokerage accounts has often placed a premium on the pink sheet traded Bitcoin Investment Trust (Symbol: GBTC), which has traded as high as a 100% premium. Closed end funds in the late 1920s often traded at large premiums.
Opportunistic CEOs, entrepreneurs, investment product suppliers, snake oil salesmen and fraudsters come out of the woodwork during a bubble. There’s a bounty of riches to be gained by selling products of shaky quality to unsophisticated, frenzied buyers. New issues are highly oversubscribed by multiples. Initial public offerings (IPOs) associated with bubble assets spike.
During the dotcom bubble of the late 1990s, many companies with no relation to the internet changed their name by adding “.com” to the end. Prices skyrocketed for these companies. In the late 1990s, Zenith announced it would begin building TVs with internet connections, prompting its shares to rise threefold.6 During the recent cryptocurrency craze, lots of shady product is being sold via initial coin offerings, along with the introduction of ever more cryptocurrencies.
Using the same playbook the dotcom-bubble CEOs used 20 years ago, a few dozen companies trading on the exchanges have seen their stocks pop by multiples just by adding “blockchain” to their names, or by announcing they’re investing in blockchain or getting into the cryptocurrency mining business. Low-priced assets outperform because the waves of small investors entering the arena can gamble with them more easily.
- Leverage fuels buying
We can point to excessive leverage at any stock market peak, so this is the weakest bubble attribute. It’s something to note, however, if easy forms of leverage are available to purchase bubble assets. The leverage can also be subtle and behind the scenes, such as when companies introduce vendor financing, and when banks lower lending standards or use bubble values to back loans. Japanese cross-holdings during the late 1980s were a form of hidden leverage.
Leverage can also be overt, like when retail investors borrow money to buy ever more securities. Margin borrowing fueled the 1929 U.S. stock market bubble. Real estate is commonly purchased with borrowed money, and at other times, subscriptions and down payments on property to be delivered later can greatly amplify buying power.
- Bubbles are late-cycle phenomena
Bubbles occur after many years of economic growth and stock market gains. We wouldn’t expect to see a bubble right after a recession or bear market. People need to be in the mood to speculate, which often requires many years of wealth gains. Bubbles need a long period of general optimism and a supply of new investors who have not experienced losses before. Central banks are often raising interest rates during the bubble blow-off phase because that’s what they do during the late cycle period of an economic cycle. Efforts by governments to control the euphoria are generally ignored by the crowd.
Examples of Bubbles in Financial History
There are likely hundreds of bubbles that have occurred throughout human history associated with just about any asset class, including stocks, bonds, real estate, land and collectibles. Edward Chancellor’s book Devil Take the Hindmost6 describes a number of the more famous episodes. Lots of bubbles remain undocumented, while many others have only scant narratives describing the events at the time.
In this section, I’ll use the list of above attributes to assess the “bubbliness” of a variety of historical price moves commonly viewed as bubbles. The purpose of this exercise is threefold.
The first point is to illustrate that bubbles do occur throughout financial history and will likely occur in the future. Portfolio managers will have to deal with these moments at least a few times in a career, and thus we need to understand why the market loses its ability to price assets appropriately.
The second reason is to help develop skills to distinguish which large (>100%) price moves are appropriate in discounting future growth, and which big moves are destined to break lower. Bubbles represent the most extreme of the big price moves. Assessing the number and severity of the bubble attributes will help us guestimate the potential for a price collapse after an asset class experiences a large and rapid price rise.
The third reason is that the bursting of a bubble can be a large, once-in-a-generation, alpha-producing moment. We want to identify what trading approaches work in such an environment. For instance, when a bubble asset is experiencing its final parabolic blow-off top, we know the end is near (perhaps within a year). This knowledge provides a catalyst timing edge that either a bear market is near or that a new secular bull market in an alternative asset class is about to begin. This is much more valuable and usable information than having an opinion that an asset class is overvalued and then waiting years, or perhaps decades, for value to be “normalized.”
Table 1 shows a select number of bubbles that occurred throughout history, spanning tulip mania in 1637 to the Chinese equity bubble peaking in 2007. The list is by no means exhaustive – there are more associated booms related to canal stocks, railroad stocks, emerging market loans, and land in the 19th century, and perhaps a few more bubbles that occurred in the 20th century.
For each bubble, I list the attributes that were present at the time, along with the bubble peak date and the new-era thinking at the time.
Here’s the attribute list again:
- Heavy retail investor involvement
- New-era thinking
- Irrational valuations
- Five or more years of swiftly rising prices
- Parabolic rise in price
- Shorting is unattractive or impossible
- Social mania
- Product providers exploit excessive demand
- Leverage fuels more buying
- Bubbles are late-cycle phenomena
As with any assessment, simply counting is not enough. The severity of each attribute must be accounted for in assessing whether a big price move is a bubble or not. I did not account for severities in Table 1. It’s interesting that I searched for bubbles that occurred from the 1930s to 1970s and couldn’t find any. I wonder if the experience of the Great Depression and World War II suppressed risk-taking for a couple of generations. Bubbles returned when the kids of baby boomers grew up and entered the markets.
Table 1: Examples of bubbles throughout financial history

Examples of Parabolic Price Moves with Some Bubble Attributes
As discussed earlier, many large price moves, such as a 100% gain in a year, can be perfectly reasonable price action without the presence of most bubble dynamics. Prices may subsequently crash, but it wouldn’t be because prices were horribly irrational; rather, the fundamentals just changed for the worse.
Table 2 shows a list of big price moves that were followed by a collapse. The rise in gold, silver and oil prices peaking in 1980 reflected rapidly rising inflation, high uncertainty of future inflation, and uncertainty of when or if the Fed would tame inflation. Inflation had been rising since the mid-1960s, and peaked at 13% per year in 1979. Investors bought these assets out of fear, rather than optimism. The common person was selling their silverware at high prices rather than buying into the frenzy.24 These price moves have many of the same attributes as bubbles, but it’s hard to say that prices were obviously wrong.
Table 2: Historically large price moves with many bubble attributes
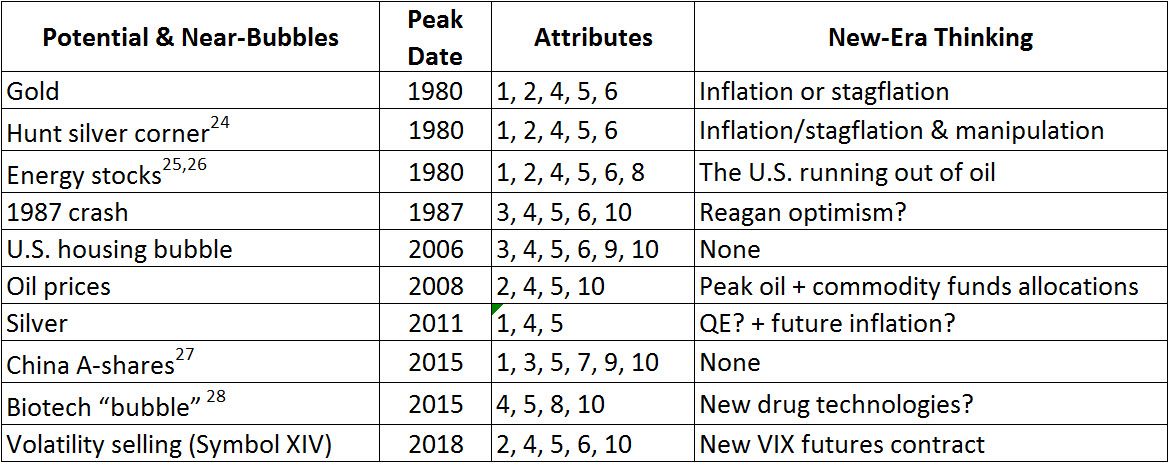
Taken to the extreme, the rapid increase in gold prices during the hyperinflation period associated with the German Weimar Republic in the early 1920s was driven by fear and a market attempting to correctly price gold. That’s not bubble-like behavior.
The rise in silver was to some extent due to a short squeeze associated with the Hunt silver crisis.24 The bubble associated with energy stocks peaking in 1980 is not documented well at all. I found just a few anecdotal articles associated with this supposed bubble, although it seems to have many of the usual bubble attributes.
I find this to be the case with all the “bubbles” associated with commodity booms and busts. Oil prices exhibited a few bubble attributes leading up to the 2008-2009 crash, but prices were driven by the fear associated with the commonly held peak-oil view prevalent at the time. Investors consider it a bubble only because prices collapsed. Yet it seems to me that prices generally reflected the fundamentals at the time.
Conventional wisdom associates the rise and fall of U.S. housing prices in the mid-2000s as an obvious bubble, but many of the bubble attributes were missing at the time. There was no new-era thinking. There was no mania around housing prices. Most people are happy to own a home that is appreciated in value.
If there is manic buying of homes, then it’s folks looking to aggressively buy ASAP because they fear being priced out of a market. After they buy, most people get on with their lives without thinking too much about further price rises.
Housing is a bit different from other assets that are more amenable to speculation. While owned primarily by retail investors and people who know very little about investing, very few people buy multiple homes just to get rich. Not to say that there weren’t a fair number of levered speculators in the asset class in the mid-2000s, but most people don’t buy five homes expecting further price increases. Buying multiple homes is just too expensive and time consuming for the average person. If there is speculation, and housing bubbles, then it’s in the cheaper portions of real estate, such as land, condos, vacation homes and commitments to buy condos.
That’s why I struggle to apply all 10 attributes to what’s commonly referred to as the U.S. housing bubble of 2006. The same can be said for the various British home price booms and busts over the past 50 years.
People have talked about the recent biotech “bubble” since 2013, and then again in 2015, as these stocks peaked after a factor of four increase since the lows of 2011.28 Yet most bubble attributes were missing from this move. There were no retail investors ratcheting up prices, no career risk for portfolio managers avoiding this subsector of the stock market, and only professional investors were involved. A large, parabolic price runup is not enough to classify this move as a bubble. Since biotech stocks peaked in July 2015, the NYSE Arca Biotechnology Index has consolidated and recently made a new high in January 2018. Not a bubble.
Volatility selling has become fairly popular recently, although no one is sure just how much money is involved in this space. Due to the low volatility environment, ETFs that systematically sell VIX futures have performed extremely well the past five years. The most popular vehicle (Symbol XIV) returned 52% per year over the last five years, ending on December 31, 2017, and returned 188% in 2017. These instruments are essentially highly levered bets on the S&P 500.
There were some bubble attributes that applied to this “asset class.” VIX futures and these funds were new financial products. Shorting these strategies was extremely unattractive because of a highly negative carry. However, there was no mania around these strategies, with heavy adoption from retail investors chasing these exceptional returns. As I was writing this article, on February 5, 2018, these vehicles lost 95% of their value in a single day. Not a bubble, though.
To summarize, not all parabolic price rises can be viewed as bubbles. By assessing how many of the bubble attributes are present at the time, we can get a better idea of how irrational prices may be. The more attributes, the more likely prices are irrationally high and the more likely a collapse is coming in the near future.
Bitcoin
The news media is never shy about pointing out potential bubbles. There are many false positives. Interestingly, in past bubbles as far back to the 1800s, the news media often was active in pointing out that the euphoria and rising prices would end badly. This is certainly the case today for bitcoin and its crypto-cousins. It’s a bubble without a doubt according to all the major financial news sources and many veteran investors.
So how does bitcoin stack up with the bubble attributes? Most apply to the cryptocurrency craze today, except the heavy use of leverage. With a spectacular parabolic move, bitcoin gained 1,400% last year on top of many years of spectacular gains. There is heavy retail investor dominance, mostly among young people with little experience in the financial markets. Digital assets and blockchain technology are obviously new and revolutionary, although for me, the advantages are much more difficult to understand compared to the obvious benefits the internet would bring to the world back in the late-1990s.
Valuing digital assets is really difficult because the asset class so new. We’ve heard the argument that digital assets should have a market cap similar to gold and/or physical currency levels. This would put the total market cap of digital assets on the order of a one to ten trillion dollars, compared to $500 billion as of January 2018. Yet there appears to be no barrier to entry to create a new cryptocurrency, so logic suggests that all but a few of the 1,500 cryptocurrencies will lose all their value one day, as their individual networks fail to hit critical adoption levels.
Shorting only recently became available with the introduction of bitcoin futures in December 2017, but shorting this craze is highly risky due to the extreme volatility. Bitcoin and cryptocurrencies are a worldwide phenomenon and a mania in many countries. This is the first bubble where retail investors from any country in the world can purchase these assets in the smallest of dollar increments.
Product providers and scamsters are all over this mania, introducing ever more cryptocurrencies and initial coin offerings (ICOs) – most will collapse in value eventually. Microcap companies with little hope in being technology winners in this space have seen their stock prices pop on announcements of cryptocurrency mining ventures or blockchain investments.
Finally, we’re late in the investing and economic cycle. The Fed is raising rates and the last major bear market ended almost nine years ago. Most people have forgotten the pain associated with a major downturn, and it seems that everyone is prospering these days with stocks, real estate and housing prices all rising for years.
Using my bubble attributes, bitcoin and all the digital assets are most definitely a bubble and should be avoided by all serious investors, other than a little smidgen for entertainment purposes if desired. Bitcoin is different than previous bubbles in a variety of ways. It’s the first worldwide bubble available to retail investors around the world. The volatility is extreme. The asset class has already weathered two boom-busts with 75%+ declines that normally pop bubbles. Yet over the past five years, bitcoin has relatively quickly recovered these losses and roared to new highs. That’s very different.
Bitcoin has currently fallen over 50% from its December 2018 high – I’m not sure if this is the end, but it appears to be. Ultimately, it doesn’t matter if digital assets and blockchain technology do indeed change the world. The price of these assets appears to be irrationally high at this moment. Amazon has indeed changed the world, yet its price fell from $103 in December 1999 to $6 in October 2001, and it’s now trading at $1,400 a share as of January 2018. It’s better to wait this out, and perhaps buy the winners when everyone has given up on the asset class after years of poor returns.
Any Other Bubbles in 2018?
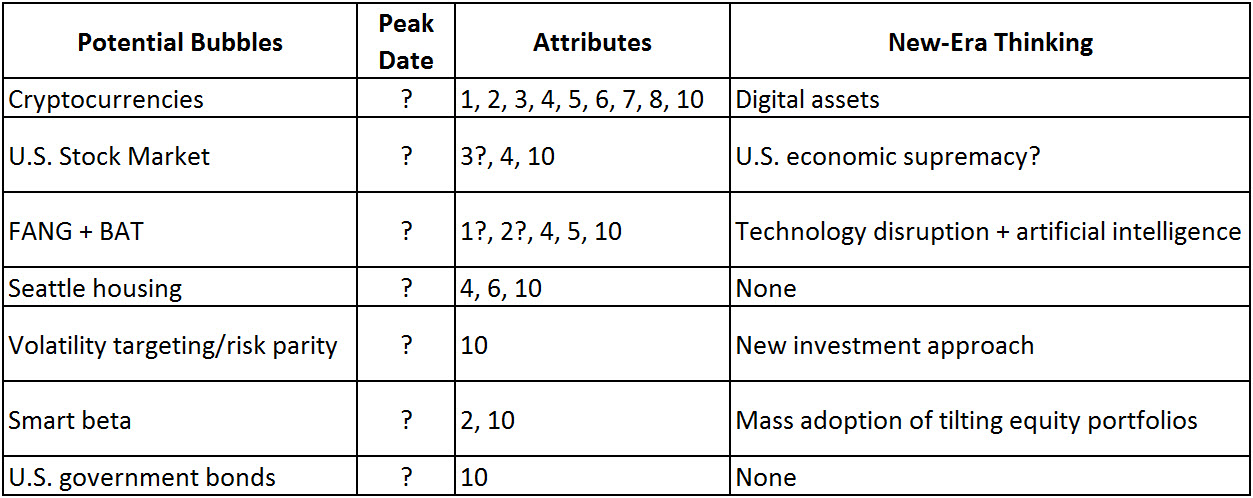
What other bubbles are potentially at work these days? We are definitely in late-cycle mode for all asset classes. In Table 3, I assess what bubble attributes are present with various asset classes often associated with bubble-talk in the media.
Is the U.S. stock market a bubble? Not many bubble attributes apply, so the answer is no, and I wouldn’t bet on a fall due to irrational pricing. Only now are retail investors starting to show some interest as the 2008-2009 and 2000-2002 bear markets fade from memory. Perhaps, as some claim, the U.S. market is extremely overvalued from a Shiller CAPE or market cap/GDP point of view. The other side of that argument is that these measures do not incorporate a view that interest rates may remain low for another decade. Notwithstanding who’s right in that argument, we know asset classes can remain expensive for years without a bear market catalyst.
What about technology stocks, in particular the FANG+BAT stocks? This is an acronym for Facebook, Amazon, Netflix, Google, Baidu, Alibaba and Tencent. You can throw in a few more big-name tech companies such as Microsoft, Nvidia, Apple and others. Perhaps there’s a little more retail investor interest in these stocks, but it’s nothing close to any sort of mania.
The technology disruption theme is hot right now, along with any company involved with artificial intelligence. Most stocks associated with these themes have had a great run gaining over 50% last year. Could this have been a been a blow-off top? Perhaps, although valuations are not excessive and shorting this theme is readily available to any professional investor. A downturn may be right around the corner and the tech disruption trade is likely crowded among mutual fund managers, hedge fund managers and traders. But that doesn’t mean pricing is hugely irrational, or that a collapse is eminent. Not a bubble, yet.
What about home prices? The top-performing market these days is Seattle, where I live. Again, retail investors (homeowners) tend to own just one house, and if there’s frenzied buying, it’s not to get rich, but to buy a home before being priced out of a neighborhood. Individual Chinese citizens have recently become attracted to Seattle, although this trend is relatively new.
Seattle home prices have risen at a 10% pace for five years as of November 2017, based on the S&P/Case-Shiller WA-Seattle Home Price Index. Prices surpassed the 2007 peak about two years ago. We have not seen a rapid acceleration in price increases (the most recent year-over-year return was 12.7%). Valuations are rich, but for foreign buyers and those moving from California, Seattle is cheap. Financing to purchase a house is not any looser than other parts of the country or compared to previous years, so leverage is not fueling price increases. Not a bubble, yet.
Other mentions of bubbles in the media include the “smart beta bubble,” the “risk parity bubble” and the “U.S. bond bubble.” These writers are using the bubble label way too loosely. Using my bubble attributes, these phenomena have nothing to do with bubbles and are better characterized as perhaps overowned by investors, long-term overvalued, or investor groupthink taking good ideas too far.
Table 3: Potential bubbles in 2018
Conclusions
Having the ability to spot asset class bubbles is an important skill that should not be performed casually. Too many people think that just because the price of an asset has doubled in a year, then it must be a bubble. I’ve identified 10 bubble attributes to help distinguish irrational bubble behavior from the large price moves associated with the rational repricing of new and improving fundamentals.
Bubbles represent the most extreme case of investors overreacting to a fabulous growth story. The bursting of a bubble is often a catalyst for an economic downturn and/or a secular trend change among asset classes, and it can be a large source of alpha when trading asset classes. In my next blog post, I’ll discuss strategies for trading asset classes that are experiencing a bubble.
References
- Greenwood, R., Shleifer, A., You, Y., “Bubbles for Fama”, Working Paper, February 2017.
- Thompson, D., This Fund Tracks 36 Bubbles, and 33 Have Popped—What’s Left?
- Grantham, J., Chancellor, E., Inker, B., “Looking for Bubbles”, GMO Quarterly Letter, first quarter, 2014.
- Shiller, R.J., Irrational Exuberance, Second Edition, 2005.
- Galbraith, J.K., A Short History of Financial Euphoria, 1990.
- Chancellor, E., Devil Take the Hindmost, 1999.
- Cannon, M., The Land Boomers, 1966.
- Simon, J., “Three Australian Asset-price Bubbles”, Reserve Bank of Australia, 2003.
- Bissonnette, Z., The Great Beanie Baby Bubble: Mass Delusion and the Dark Side of Cute, 2015.
- Mackay, C., Extraordinary Popular Delusions and the Madness of Crowds, 1841.
- Hoyt, H., One Hundred Years of Land Values in Chicago, 1933. Chapter 1.
- Guinn, J.M., Beck, J., A History of California and an Extended History of Los Angeles, 2015. Chapter 38.
- Simon, J., “Three Australian Asset-price Bubbles”, Reserve Bank of Australia, 2003.
- Turner, G.M., The Florida Land Boom of the 1920s, 2015.
- Ballinger, K., Miami Millions: The Dance of the Dollars in the Great Florida Land Boom of 1925, 1936.
- Colombo, J., Kuwait’s Souk al-Manakh Stock Bubble
- Wood, C., The Bubble Economy: Japan’s Extraordinary Speculative Boom of the ‘80s and the Dramatic Bust of the ‘90s, 2005.
- The Obscure Certified Coin Bubble of the Late 1980s
- The baseball card bubble: How a children’s hobby turned into a classic financial mania
- Have Baseball Card Values Risen in 20 Years?
- Lowenstein, R., Origins of the Crash: The Great Bubble and Its Undoing, 2004.
- Cassidy, J., con: How America Lost Its Mind and Money in the Internet Era, 2003.
- How we explain the Chinese stock market bubble?
- Fay, S., The Great Silver Bubble, 1982.
- Fisher, K., 1980 Revisited, 2001.
- Wanger, R., “The Bait, Bacle and Bubble”, Squirrel Chatter, November 16, 2001.
- 2015–16 Chinese stock market turbulence
- Kelleher, K., The Biotech Bubble May Finally Have Popped
Disclosure
The content contained within this blog reflects the personal views and opinions of Dennis Tilley, and not necessarily those of Merriman Wealth Management, LLC. This website is for educational and/or entertainment purposes only. Use this information at your own risk, and the content should not be considered legal, tax or investment advice. The views contained in this blog may change at any time without notice, and may be inappropriate for an individual’s investment portfolio. There is no guarantee that securities and/or the techniques mentioned in this blog will make money or enhance risk-adjusted returns. The information contained in this blog may use views, estimates, assumptions, facts and information from other sources that are believed to be accurate and reliable as of the date of each blog entry. The content provided within this blog is the property of Dennis Tilley & Merriman Wealth Management, LLC (“Merriman”). For more details, see the Important Disclosure.