
 In the last blog, I discussed the trading edge associated with predicting investment flows. In this blog, I’ll provide examples using this trading edge to pick outperforming asset classes. Of course, this is a hypothetical exercise with the full benefit of hindsight, and as is often the case, flows may not be the only cause of the observed performance.
1995 to 1999
This era is widely recognized as the culmination of the 1982 to 1999 secular bull market in U.S. equities. As shown in Figure 1, it was a time when retail investors were obsessed with stocks as illustrated by the meteoric rise in CNBC viewership.1 Index investing was also becoming very popular, but at that time indexing solely meant investing in the S&P 500. Mutual fund managers were the investment stars of the era.
Figure 1. CNBC viewership history.1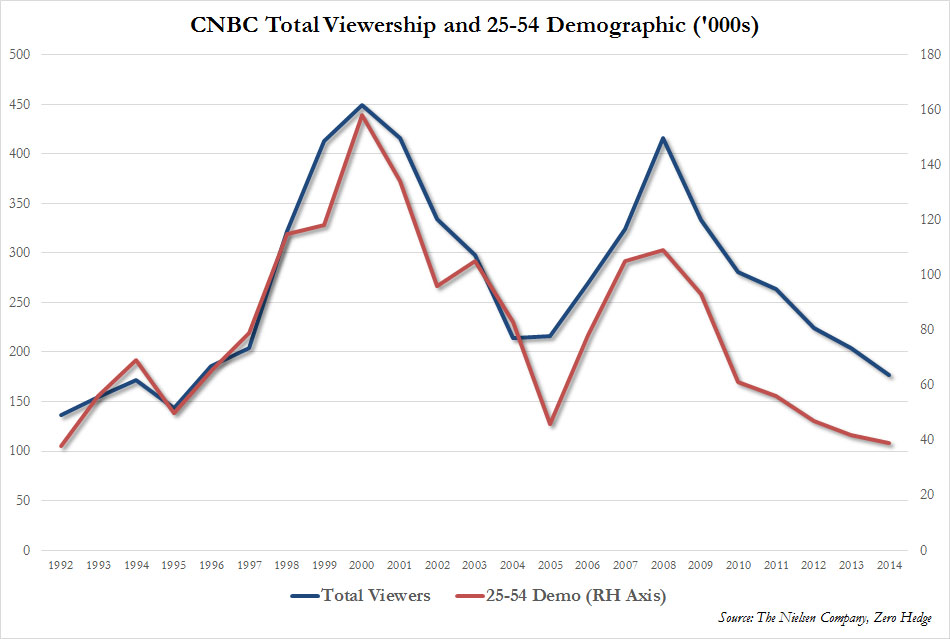
Figure 2 from Ned Davis Research shows equity mutual fund net flows as a percentage of U.S. market capitalization from 1960 to present.2 These flows can be attributed primarily to retail investors, who throughout the 1990s powered a strong equity bull market.
Figure 2. Equity mutual fund flows as a percentage of total market value.2
Retail investors at the time were adamant performance chasers, with flows following the best 12-month performers. Toward the end of the period, investors narrowed their focus to U.S. large cap growth stocks, particularly those associated with technology, the Internet and the NASDAQ 100. At its zenith in early 2000, the majority of fund flows fed these growth stock categories, at the expense of outflows from value funds and other “old economy” asset classes.
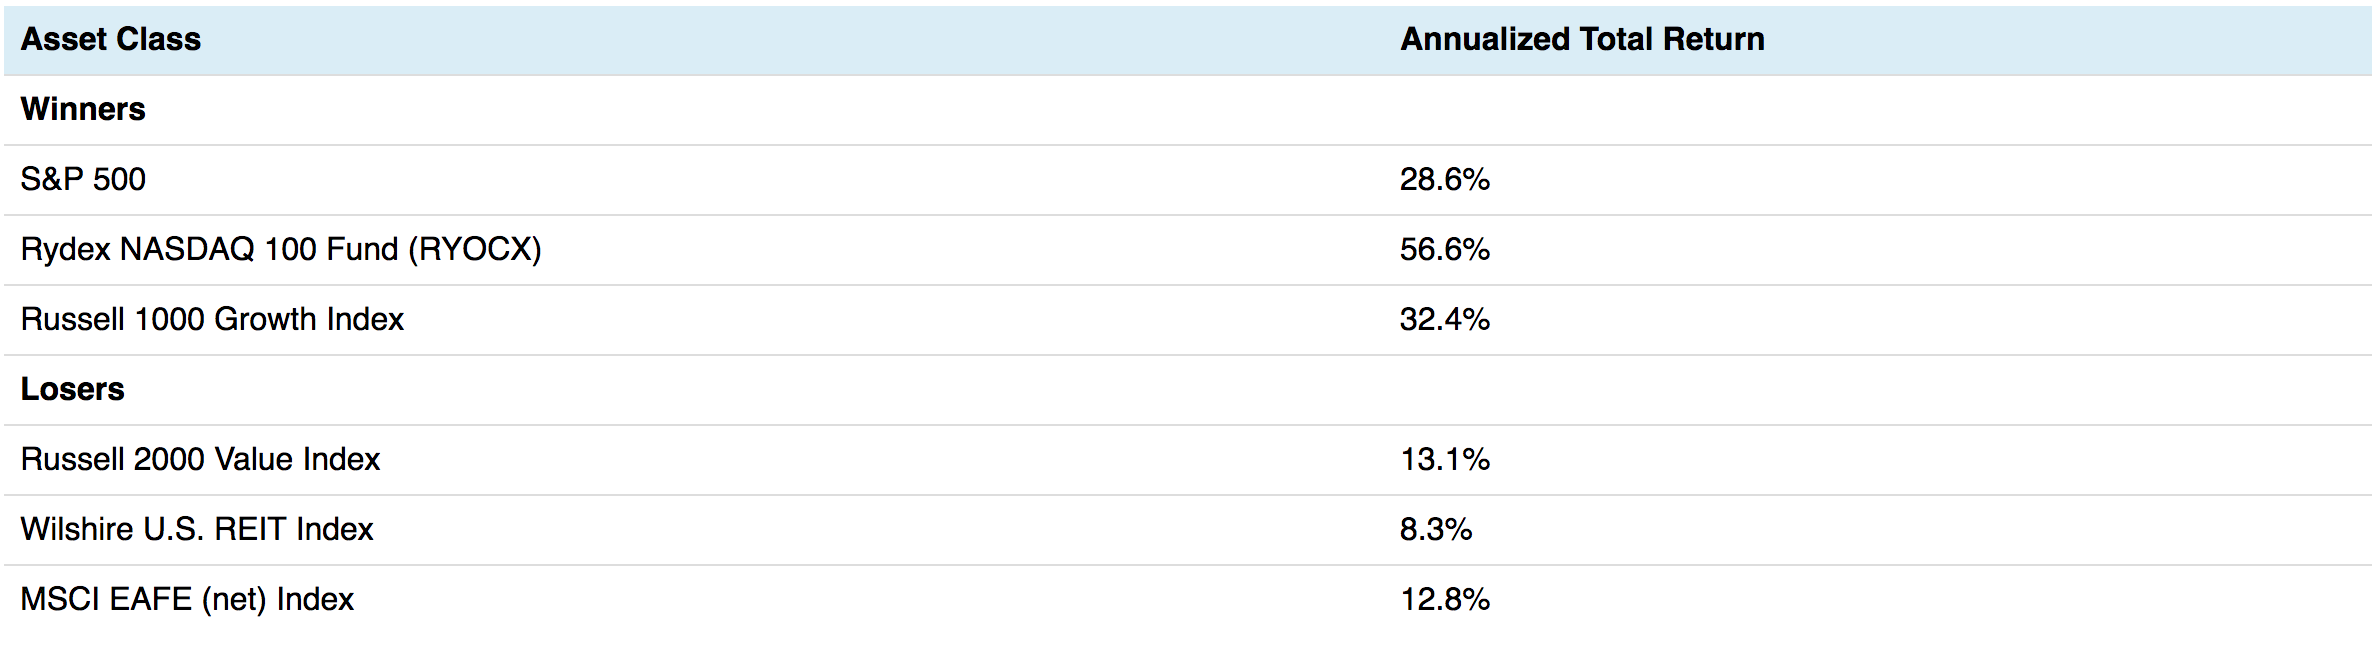
Table 1 shows the relative performance of various asset classes from 1995 to 1999. Late in the period, retail and institutional investors sold their value funds, value shops shuttered and portfolio managers were fired. Legendary investment greats such as Julian Robertson, Stanley Druckenmiller, Warren Buffet, Jeremy Grantham and Robert Sanborn all faced intense investor and media scrutiny. Riding this immense allocation wave would have generated tremendous alpha assuming you could ignore the bubble forming.
Table 1. Selected asset class returns from 1995 to 1999.3
2000 to 2002
The bursting of the tech bubble in March 2000 triggered a long secular bear market for U.S. large cap growth stocks, and a bull market in value stocks and old-economy sectors such as REITs. Technology stocks, the S&P 500 and large cap growth stocks were heavily over-owned. Once the bubble burst, it was best to avoid these asset classes due to what would be a perpetual headwind of outflows over the next 5 to 10 years. Sidestepping these stocks was an easy source of alpha, especially since they made up a large portion of stock market benchmarks.
Cash raised from the selling of technology and U.S. large cap growth stocks had to flow somewhere, and value stocks and REITs were two beneficiaries. This was an ideal situation – flows out of a highly liquid large-cap asset class into less liquid asset classes. Small cap value stocks, which sit kitty-corner from large cap growth stocks in the Morningstar style box, rose sharply in 2000 and 2001 in the midst of a severe equity bear market that would eventually cut the S&P 500 by half.
Table 2 shows the annualized performance of these asset classes during the 2000 to 2001 time period. It is very unusual to see any equity asset class rise in value by so much during such a vicious bear market.
Table 2. Selected asset class returns from 2000 to 2001.3

Figure 3 shows a plot of the Russell 2000 value index versus the S&P 500 from the 2000 to 2005. The Russell 2000 Value index dramatically outperformed the S&P 500 during that time period as shown by the relative strength line on the bottom clip. Even when small cap value stocks finally succumbed to the three-year bear market with losses in 2012, the asset class continued to outperform the S&P 500.
Often the bursting of a bubble can be a catalyst and a huge source of flows to fuel a bull market elsewhere. Flows were also complemented by the very attractive valuations associated with value stocks at the start of this move.
Figure 3. Russell 2000 Value index versus the S&P 500 index from Q2 2000 to Q2 2005.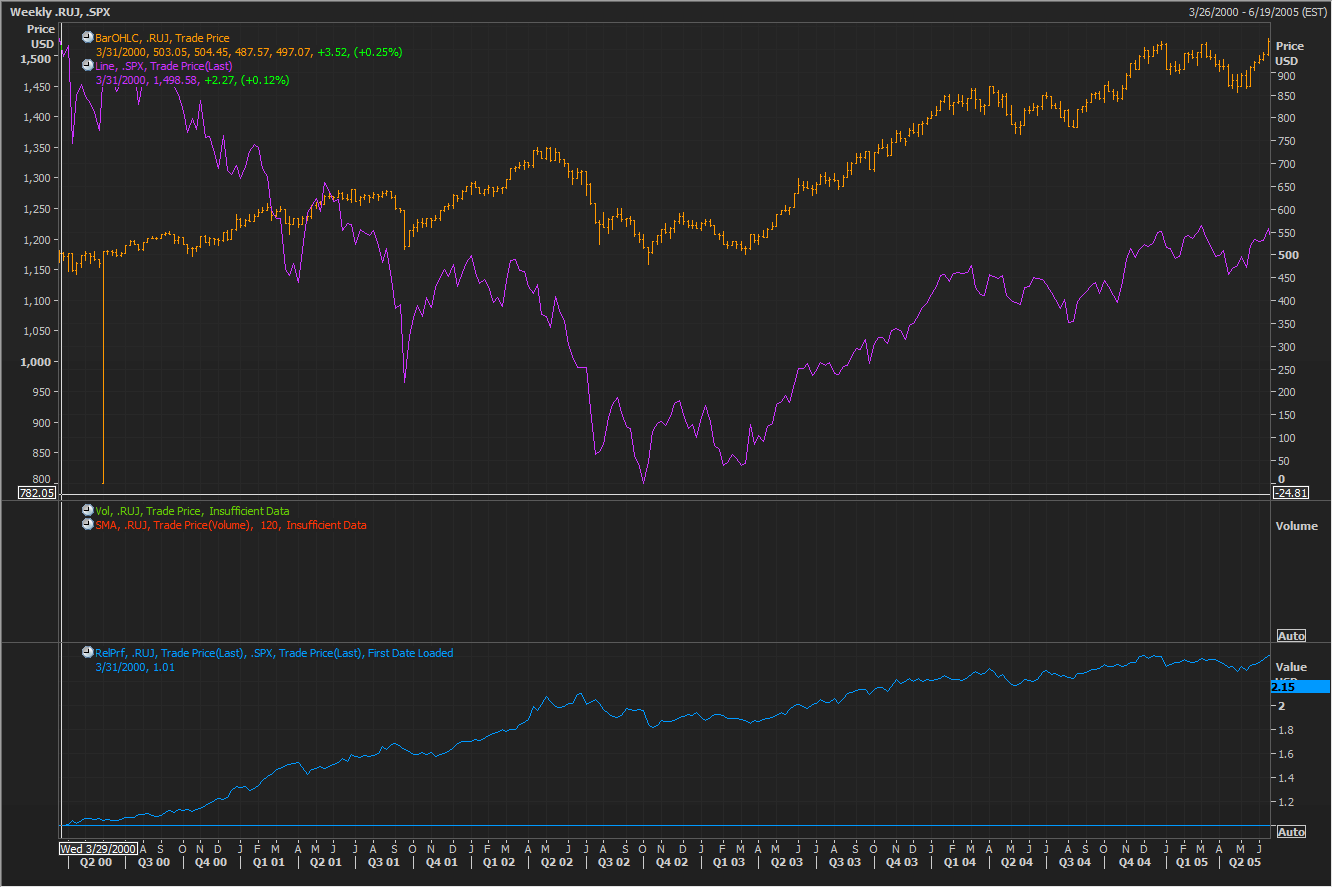
2003 to 2007
After getting battered by the NASDAQ crash and subsequent three-year bear market, retail and institutional investors realized their equity portfolios were not as diversified as originally thought. Holding five growth mutual funds does not constitute a diversified portfolio. Proper diversification became the new allocation theme to the benefit of international and emerging market stocks, REITs, small cap value stocks, international small cap stocks, gold and commodities.
This allocation wave lasted for years leading up to the next bear market in 2008 to 2009. Avoiding U.S. large cap stocks was an alpha-generating trade if you heeded the fund flows edge. Table 3 shows the annualized returns associated with asset class winners and losers during this time period. At the start of this period, emerging market stocks (and bonds) were severely under-owned. These asset classes were the star performers as investors ramped up their allocations to more appropriate levels.
Table 3. Selected asset class returns from 2003 to 2007.3

2008 to 2009
During bear markets, it’s best to ignore fund flows. Often, the asset classes that received the most fund flows during the previous bull market are also among the best performing and popular with investors, traders and hedge fund managers. When the market turns down, we generally see outflows among the highest-flying asset classes. These are short-term flows that are coincident with falling prices. We have no edge associated with gaming flows on the short time scale.
Obviously it’s next to impossible to know when a bear market is coming, so it’s only after the market has rolled over, with the major indices down 10-15%, that you can make this sort of realization. Most likely, the asset classes with the strongest flows leading up to the market top will have underperformed the major indices, as traders rushed out of these holdings. This is the time to “turn off” this edge, along with momentum, because these tools are no longer useful for providing an edge. The fund flows edge can again be used 6 to 12 months after the overall market has bottomed.
2010 to 2014
Two severe bear markets in a decade can permanently damage retail investor morale. After the 2008 to 2009 financial crises, retail investors essentially gave up trading and investing for themselves. CNBC viewership numbers (see Figure 1) continue to make new lows even though the S&P 500 has rebounded to new highs. This chart is consistent with the view that retail investors have basically left the equity trading arena.
As the Fed cut short-term interest rates to zero, institutional investors began a major shift from stocks and bonds into alternatives – primarily hedge funds, direct real estate and private equity. As a trader of liquid asset class vehicles, there was no way to play this trend from a flows perspective.
Retail flows into bonds became an asset allocation trend as investors combated low interest rates in money market accounts, as shown in Figure 4. Various spread product asset classes such as corporate bonds, high yield bonds, emerging market bonds, preferred stock and non-agency mortgage back securities produced attractive returns up to mid-2013 when the Fed set off a severe bond market sell-off, the so-called “taper tantrum.” Since then, flows have been sporadic due to investor concern regarding the Fed’s eventual lifting of short-term rates.
Figure 4. Bond fund flows from 2007 to 2015.2
During this time frame, there was no major fund flows trading edge in the equity space. However, the S&P 500 doubled during that time frame, rising at a brisk 15.5% per year. International stocks lagged, rising at only 5.3% per year pace. It’s very difficult for me to attribute the U.S. equity bull market to flows. Institutions were net-sellers of stocks and retail investors had given up the game.
Perhaps the bull market in U.S. equities was the result of market participants re-pricing stocks for an extended zero interest rate environment and other fundamentals, such as enhanced profit margins. The fair value of the stock market increased considerably over this time frame.
The only edge associated with equity flows during this time period was due to corporate buybacks. U.S. companies repurchased stock at a rate on the order of $200 billion per year since 2011.4 This sort of financial engineering was facilitated by fat profit margins, high cash balances and historically low interest rates.
One way to play this trend was to own the stocks associated with companies most heavily engaged in these buyback programs. This sort of buying is generally mechanical and price-insensitive. The PowerShares Buyback Achievers Fund ETF (Symbol: PKW) owns these stocks. The third clip of Figure 5 shows a nicely up-trending relative strength line of this ETF versus the S&P 500 index over this time period (2010 to 2014), where PKW produced a 19.4% annualized return versus 15.5% for the S&P 500.
Figure 5. PowerShares Buyback Achievers Fund (PKW) versus the S&P 500 index from 2010 to 2015.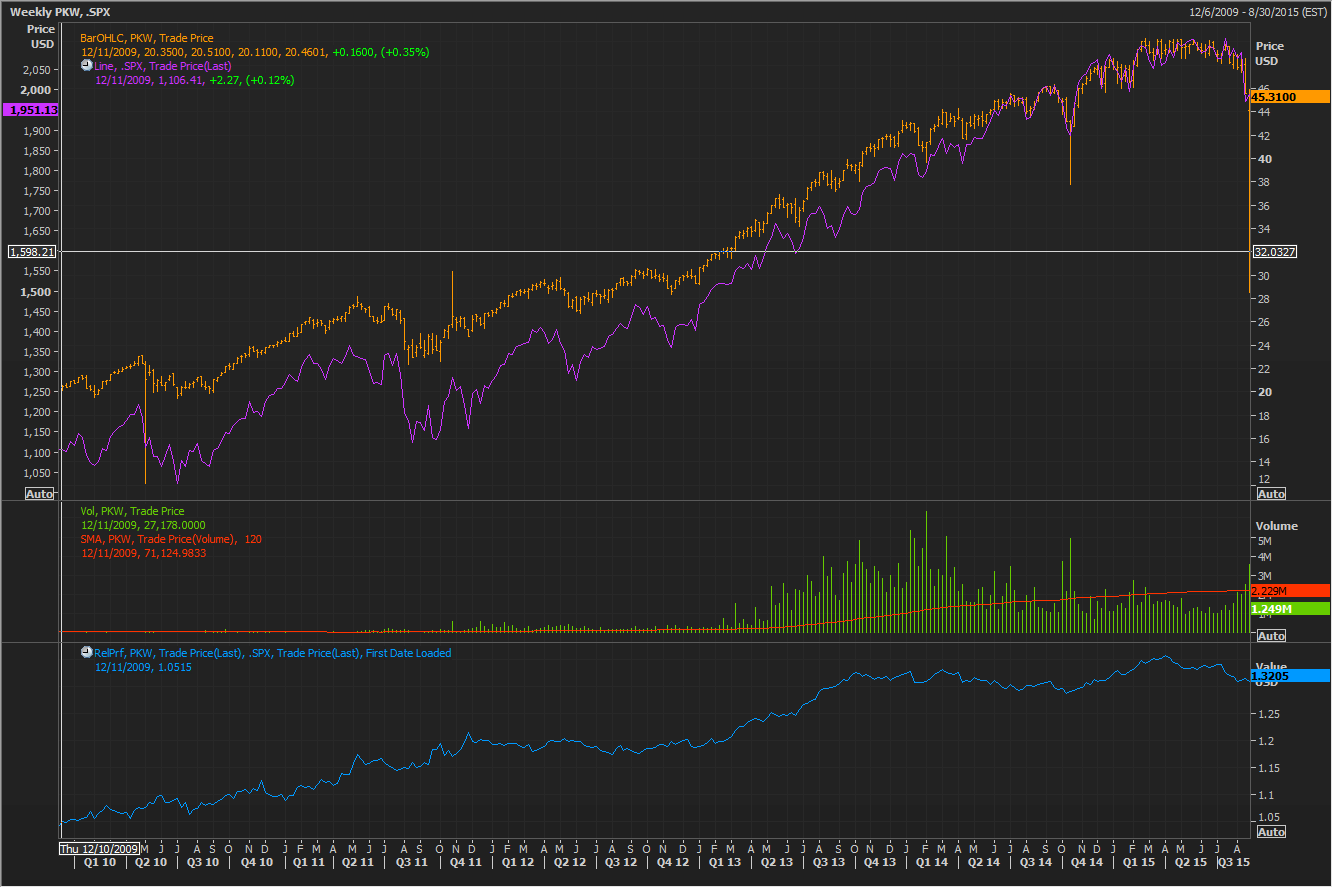
2015
At this time, there is not much of an edge associated with fund flows among the stock and bond asset classes. Retail investors continue to be MIA. There may be some meat on the bone associated with buybacks using PKW and among U.S. midcap stocks with the TrimTabs Float Shrink ETF (symbol: TTFS). Foreign companies also have the same opportunity to issue debt at very low interest rates, and repurchase their stock, and a relatively new ETF, the PowerShares International Buyback Achievers Portfolio (symbol: IPKW), can be a way of playing this trend.
The recent run-up of Chinese A-shares stocks is another example of heavy retail flows chasing performance and driving up prices. This allocation trend occurred over about a year’s time frame from mid-2014 up to the bubble bursting in June 2015. Now that the bubble has popped, the trading edge is gone.
Japanese stocks are another potential market with a fund flows trading edge. Extremely large pension plans have begun shifting their portfolios from bonds to stocks.5 Japanese retail investors, who are also significantly underweight stocks, are likely to follow over time. These flows could represent a tailwind for Japanese stocks versus the MSCI All Country World Index. Hedging the yen exposure, or using a yen-hedged ETF, may be a better way to play this trend since the Japanese central bank is actively seeking a weaker yen.
Conclusions
Following fund flows is an effective asset class trading edge when the flows represent price-insensitive asset allocation moves, and the flows are large and expected to continue for the next year. In this blog I provided a short history of using this edge to trade asset classes. At this time, there’s not much of an edge associated with flows, but that doesn’t mean there won’t be opportunities in the future. The key is to be on the lookout for shifts in how investors are allocating portfolios, and to jump on an emerging trend as soon as possible.
References
- Durden, Tyler, “CNBC’s SquawkBox Has Lowest Nielsen Rating In Its History”, Zero Hedge, March 31, 2015. http://www.zerohedge.com/news/2015-03-31/cnbcs-squawkbox-has-lowest-nielsen-rating-its-history
- Ned Davis Research, www.ndr.com, chart S0440. (Subscription required.)
- morningstar.com, using the Morningstar Advisor Workstation 2.0. (Subscription required.)
- Ned Davis Research, www.ndr.com, chart S470.
- Warnock, E. and Narioka, K., “Japan Mega-Pension Shifts to Stocks”, Wall Street Journal, October 31, 2014. http://www.wsj.com/articles/japan-mega-pension-to-shift-to-stocks-1414720683
Disclosure
The content contained within this blog reflects the personal views and opinions of Dennis Tilley, and not necessarily those of Merriman Wealth Management, LLC. This website is for educational and/or entertainment purposes only. Use this information at your own risk, and the content should not be considered legal, tax, or investment advice. The views contained in this blog may change at any time without notice, and may be inappropriate for an individual’s investment portfolio. There is no guarantee that securities and/or the techniques mentioned in this blog will make money or enhance risk-adjusted returns. The information contained in this blog may use views, estimates, assumptions, facts, and information from other sources that are believed to be accurate and reliable as of the date of each blog entry. The content provided within this blog is the property of Dennis Tilley & Merriman Wealth Management, LLC (“Merriman”). For more details, please consult the Important Disclosure link here.