
Does momentum really work? Can you outperform benchmarks by simply holding top-performing securities? I have my doubts, but I’ve decided to be open-minded and revisit this idea.
A decade or two ago, we used momentum extensively to select equity asset classes and avoid the poor performers.  I lost faith in momentum somewhere in the 2009 to 2010 time frame after the premium suffered a historically large drawdown in 2009.
We turn off momentum at the beginning of new bull markets, so we didn’t suffer from this drawdown, but hedge fund assets had grown exponentially to over $2 trillion at the time, and momentum mutual funds were being introduced. The strategy appeared to be very crowded.
Momentum was a great trading edge for many decades. Now it’s just too easy to do and too popular with an enormous amount of assets implementing momentum in various forms.
Let’s define the momentum effect. The idea is that top performing assets over a 3 to 12 month time frame tend to outperform over a similar time frame. Poor performing assets tend to underperform in the near future. Momentum is sometimes confused with trend following.1 Momentum ranks recent performance among peers, such as ranking U.S. stocks among each other, or U.S. sectors among each other, or individual country stock market indices among each other. Trend following looks at absolute prices and asks if prices are in an uptrend or downtrend, and shifts to cash or shorts an asset when prices are in a downtrend. Momentum indices remain exposed to falling prices, and thus can suffer large losses during bear markets. Long-short momentum portfolios can also suffer enormous equity-like drawdowns.
A typical momentum measure is 12-month performance, although the sweet spot look-back period can vary from 6 to 15 months. For really short time periods, one month or less, there’s a short-term reversal effect where top performers typically underperform during the next month. 2-4 As the look-back period extends beyond a few years, recent top performers begin to lag the averages in the future and the bad performers tend to do better as the latter are now underowned and better valued with higher expected returns.
The most popular momentum performance series is published on Ken French’s website4 for the U.S. stock market. The Fama-French (FF) momentum series is constructed monthly by ranking U.S. stocks by one-year performance minus the last month’s return (by convention to reduce the impact of the one-month reversal effect). Stocks in the top thirtieth percentile are considered to be in the “Up” momentum group. Stocks in the bottom 30% are in the “Down” momentum group. The momentum premium for a given month is the difference in Up Momentum and Down Momentum performance (Up-Down, or UMD).
The momentum series can also be split between small cap and large cap stocks, and for each Up and Down group, there are two options: market cap weighted (MW) or equal weighted (EW). The U.S. momentum series goes back to the 1930s, while international market series go back to the early 1990s.
Momentum premiums are quite large. The FF Large Cap Equal-Weight Up-Momentum Portfolio has returned 15.3% per year for the 81 years from 1936 to 2016. The FF Small Cap Equal-Weight Up-Momentum Portfolio returned 19.8% per year, while the S&P 500 returned 10.4% per year during that time frame.
Momentum has also been observed to work over many decades (going back 200 years), with many different markets, for stocks, bonds, currencies and commodities.2,5 With that evidence, momentum passes many robustness tests associated with a sustainable trading edge. As an asset class trader, this tool appears very attractive. But ranking stocks on past performance is extremely easy to implement, with no barriers to entry, and there’s no good risk explanation to support long-term success in the face of heavy adoption.
The first academic evidence of the momentum effect was published in 1993 and 1994.6,7 However, various hedge funds, mutual funds, newsletters and traders used momentum for a decade or two before that. For example, in 1988, William O’Neil first published his CANSLIM stock-picking approach using momentum as one factor.8 The NoLoad FundX newsletter advisory service has successfully used momentum to rank mutual funds and ETFs since 1980.9
Why Does Momentum Work?
Momentum is a behavioral effect. Some risk-based explanations have been proposed, 1,10 but I’m not impressed by such explanations. Chasing winners is actually a pretty comfortable thing for most humans to do.
One behavioral explanation is the so-called disposition effect, which is the tendency for investors to sell winners and hold on to losers, thus causing prices to slowly adapt to changing fundamentals.
For a long time, I believed performance chasing was a great explanation for momentum, especially among asset classes. Academics call this behavior the bandwagon or herding effect, and I’m sure this plays a role at times.
However, it appears the systematic underreaction to new information may be the best explanation. How does this work? Investors are slow to act due to a variety of explanations: they’re conservative, they dollar-cost-average into shares, they suffer from anchored views, they update their views incrementally, they’re not paying full attention, they suffer from time lags due to investment committee bureaucracies, etc. In general, on average over time, investors are slow to accept the full impact of new information. I certainly felt myself reacting slowly to the recent surprising Trump victory – I spent days observing market action before I updated my views. A recent paper from Novy-Marx suggests the momentum effect among U.S. stocks can be completely explained by earnings momentum; in other words, investors not fully incorporating changes in earnings prospects.11
I think we can generalize this view when using momentum to identify winners among asset classes. To summarize, investors tend to systematically underreact to market moving news, and at times, performance chasing and fund flows can also explain why momentum can work.
Why Should Momentum Work in the Future?
This blog is about trading asset classes. We use momentum to consider overweighting U.S. stocks versus international stocks, comparing value versus growth, small cap versus large cap, which sectors to own, etc. We implement trades with ETFs. To evaluate the future usefulness of momentum, though, we’ll examine the momentum effect among U.S. stocks. Why is that?
Momentum is most adopted in selecting U.S. stocks. We have a data set going back to the 1930s. It’s an arena many hedge funds compete in using momentum as one factor, so the U.S. stock market should be the first to show degradation due to mass adoption. We’ll use this analysis and lessons learned to generalize the use of momentum to rank asset classes. Also, if momentum survives this critique, then we can use newly issued, low-cost momentum ETFs to outperform various market indices without having to pick and trade the underlying stocks.
There are two worries associated with momentum’s success in the future, and asset growth of momentum traders affects both. The first is whether the momentum effect is useful net of transaction costs. Second, the performance associated with the FF momentum indices is extremely attractive. The return premium should be arbitraged away by hedge funds and mutual fund managers, especially since implementing a momentum ranking system is so easy.
Momentum is a high turnover, liquidity-demanding strategy. It has a many orders of magnitude lower capacity than a factor like value. The FF momentum series ignore transaction costs, and with a turnover of around 300%, perhaps the effect is an illusion when accounting for actual transaction costs.
This has been a long critique by academics ever since momentum results were first published in academic journals in the early 1990s. 1,12,13 Papers modeling transaction costs with the bid/ask spread12 suggest the momentum effect is all but eliminated when accounting for such costs. Market impact costs, if the transaction sizes are large enough to move prices, were not modeled.
No doubt, momentum’s biggest and most influential proponent right now is AQR Asset Management. They also introduced the first mutual funds to systematically invest in the momentum premium back in 2009. They refute the transaction cost critiques as being very crude and not accounting for well-engineered, sophisticated, transaction cost minimization techniques. They show with actual momentum trading data that transaction costs are an order of magnitude lower than what the bid/ask spread suggests.13 Independent work by Novy-Marx and Velikov also suggests that increasing holding periods can also dramatically reduce costs while maintaining a health momentum premium.12
A second and more important effect must be investigated, independent of arguments over transaction costs. Can the momentum effect be arbitraged away as more and more assets are managed using momentum, much like how the effectiveness of trend following has been arbitraged away? Both strategies are high turnover and liquidity demanding.
How do lots of assets and momentum traders hurt the premium? Stocks entering the top ranks are bid even higher by all the buying pressure associated with momentum traders. This causes all traders to pay (on average) a higher price than if fewer traders were using momentum. Likewise, as stocks exit the top ranks, or enter the bottom ranks, the selling pressure by momentum traders causes “bad pricing” for all. More assets trading momentum sows the seeds of its own downfall. Since the FF momentum series does not account for transaction costs, we can use this series to get an idea of this arbitrage effect over the decades.
Analysis with the Zero-Transaction Cost FF Momentum Series
Technologies required to implement momentum have changed dramatically over time. As implementing momentum went from extremely difficult to exceptionally easy, and as momentum became commonly accepted and implemented in ETFs, we’d expect the momentum premium to fall over time. If momentum was a reflection of some sort of risk premium, or an effect with an unlimited supply of behavioral alpha, then we’d expect the premium to appear stable.
Transactions costs, data set availability, awareness of momentum and computational costs all factor in. Let’s look at a timeline of milestone events affecting the momentum premium in Table 1.
Table 1: Milestone events associated with momentum implementation costs.
| 1964 | First CRSP individual stock database completed. |
| 1975 | May Day – deregulation of stock commissions. |
| 1981 | IBM Personal Computer introduced. |
| 1991-1994 | Academic “discovery” of momentum effect. |
| 2001 | Decimalization. |
| 2000-2007 | Hedge fund proliferation. |
| 2009 | AQR introduces first mutual fund with systematic exposure to momentum premium (with an expense ratio of ~0.5%). |
| 2013 |
Barclays iShares introduces momentum ETF (MTUM) with an expense ratio of 0.15%. |
There are several key dates that could mark a broad or sharp inflection point in the momentum premium over the decades. The Center for Research in Securities Prices (CRSP) database allowed researchers to simulate a momentum effect for the first time. I’m guessing very few money managers (if any) were using momentum before this date.
Computational power grew exponentially over the past 50 years. I use the introduction of the IBM PC in 1981 as the inflection point at which performing calculations required to rank stocks by past performance went from difficult to easy.
Hedge funds and newsletters used momentum for many years (perhaps decades) before the academic discovery of momentum in the early 1990s. I’ll use 1991 as a milestone date for this event, although academic discoveries can take a generation before becoming generally accepted in the investment world.
Two of the most important inflection points occurred in the 2000s, which could lead to a sharp reduction of the momentum premium. First, decimalization significantly reduced transaction costs (at least for small purchases) by dramatically shrinking the bid/ask spread, especially with small cap stocks. Second, the factor-of-ten increase in hedge fund assets during the 2000s represents the mass adoption stage since momentum is a bread and butter tool for hedge funds. The introduction of cheap ETFs to provide exposure to the momentum effect, as part of the smart beta and ETF revolutions, is another marker for mass adoption. The iShares momentum ETF (MTUM) now has almost $2 billion in assets.
The first four dates above are probably very broad inflection points that marked the “beginning of the end,” rather than a potential sharp drop-off in momentum effectiveness. The last four, all occurring after the turn of the century, represent a much more serious threat to the momentum premium.
Figure 1 shows the rolling five-year average of FF momentum premium split between small cap and large cap stocks. Specifically, it’s the 60-month average of the monthly difference of the performance of the market cap weighted portfolio of high momentum stocks (the top 30%) minus the market cap weighted portfolio of low momentum stocks (the bottom 30%). Also shown are the various milestone dates shifted out by five years.
The large cap momentum premium certainly became more volatile since 1970 as the various inflection dates passed, but it’s hard to say if the premium has been arbitraged to zero considering the volatility over the entire period. The small cap momentum premium was much more stable and strong leading up to the point of decimalization and hedge fund proliferation. At that point, the small cap momentum premium collapsed even before the 2008 to 2009 bear market.
Figure 1: Rolling 5-year average of the momentum premium.
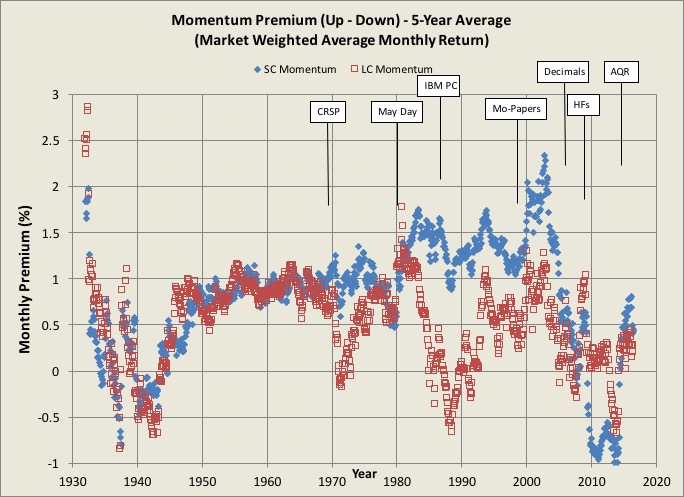
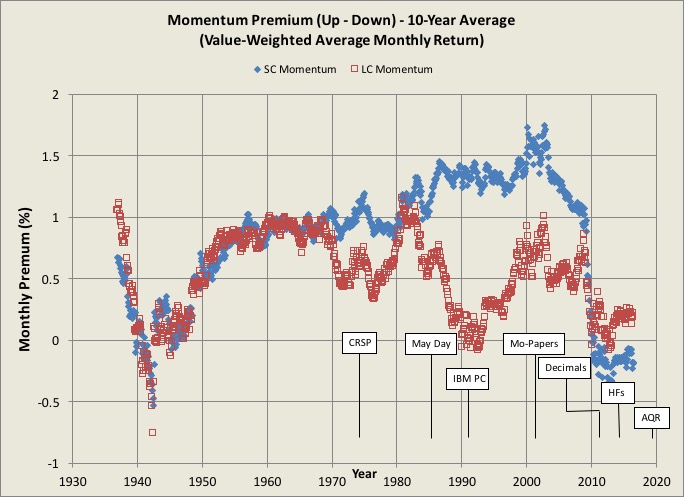
Figure 2 shows the 10-year rolling average, again with the milestone dates now shifted out 10 years. This chart, at least by eye, shows a downtrend in the large cap momentum premium as the various milestone dates pass, and a sudden collapse in the small cap momentum premium corresponding to the introduction of decimalization and the proliferation of hedge funds.
Figure 2: Rolling 10-year average of the momentum premium.
Rather than relying on eyeballs, Table 2 shows the market weighted large cap premium versus the S&P 500 for six time periods corresponding to milestone dates. We also separate long momentum and short momentum, and use annual return data. The premiums, at least pre-CRSP, pre-IBM PC and pre-academic discovery, are all relatively stable at around 4% per year. After these dates, we definitely see a degradation in the premiums, with the largest reduction starting in 2004.
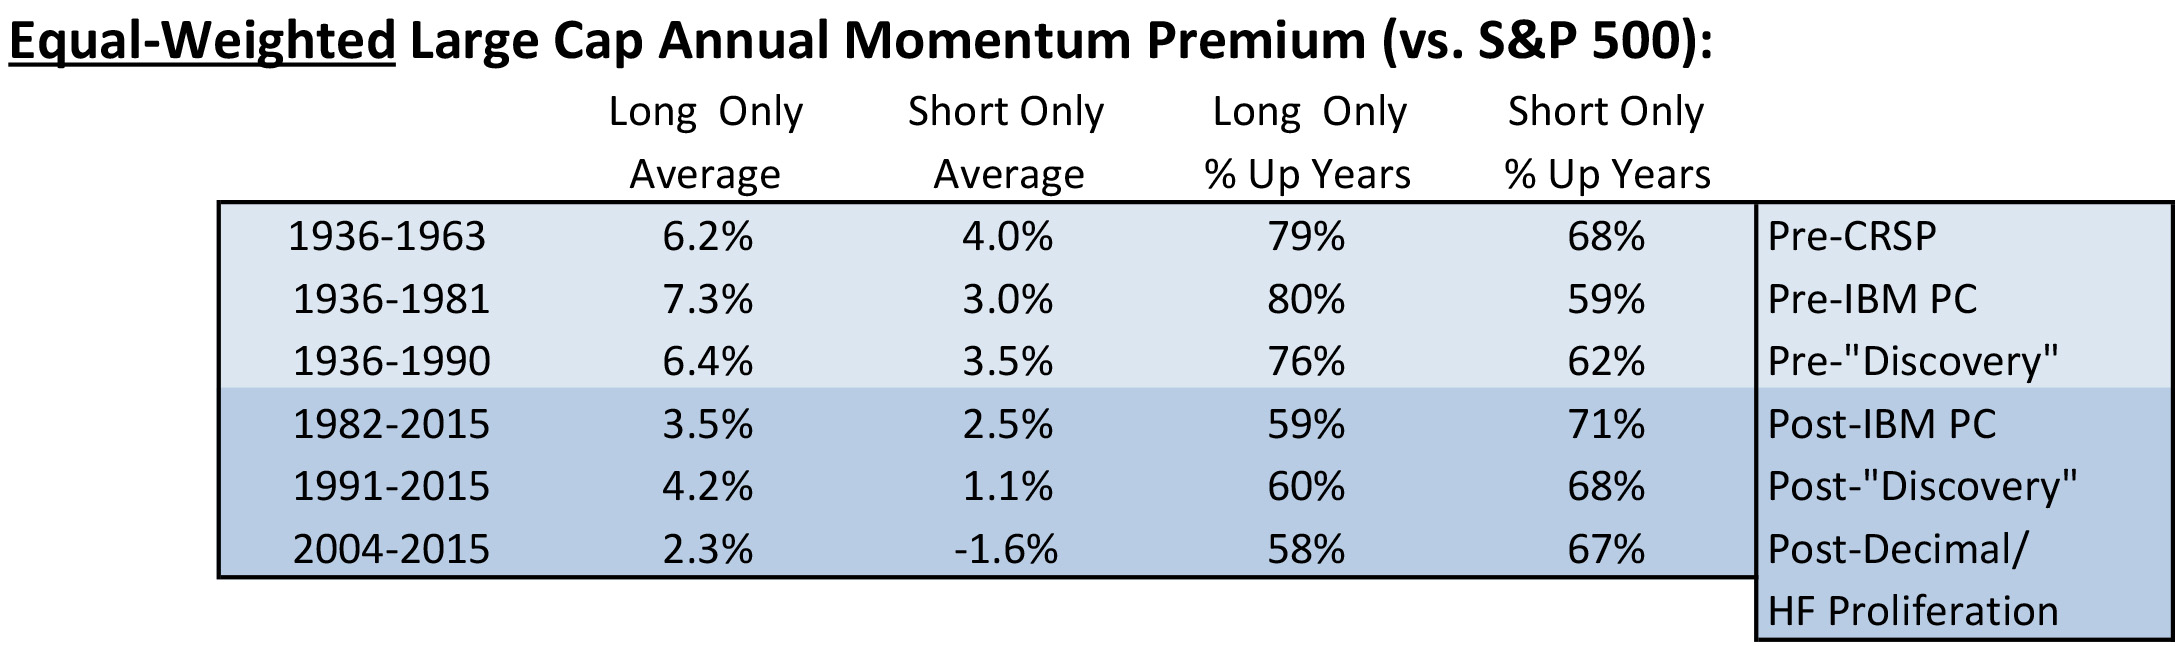
Table 3 shows the results using equal weighted data, which essentially show the same trends. The success rate of long momentum also appears to be falling. The bottom line is that before transaction costs, the momentum premium has shrunk consistent with various implementation and adoption milestone dates.
Table 2: Long and short market weighted momentum premiums for various time periods.
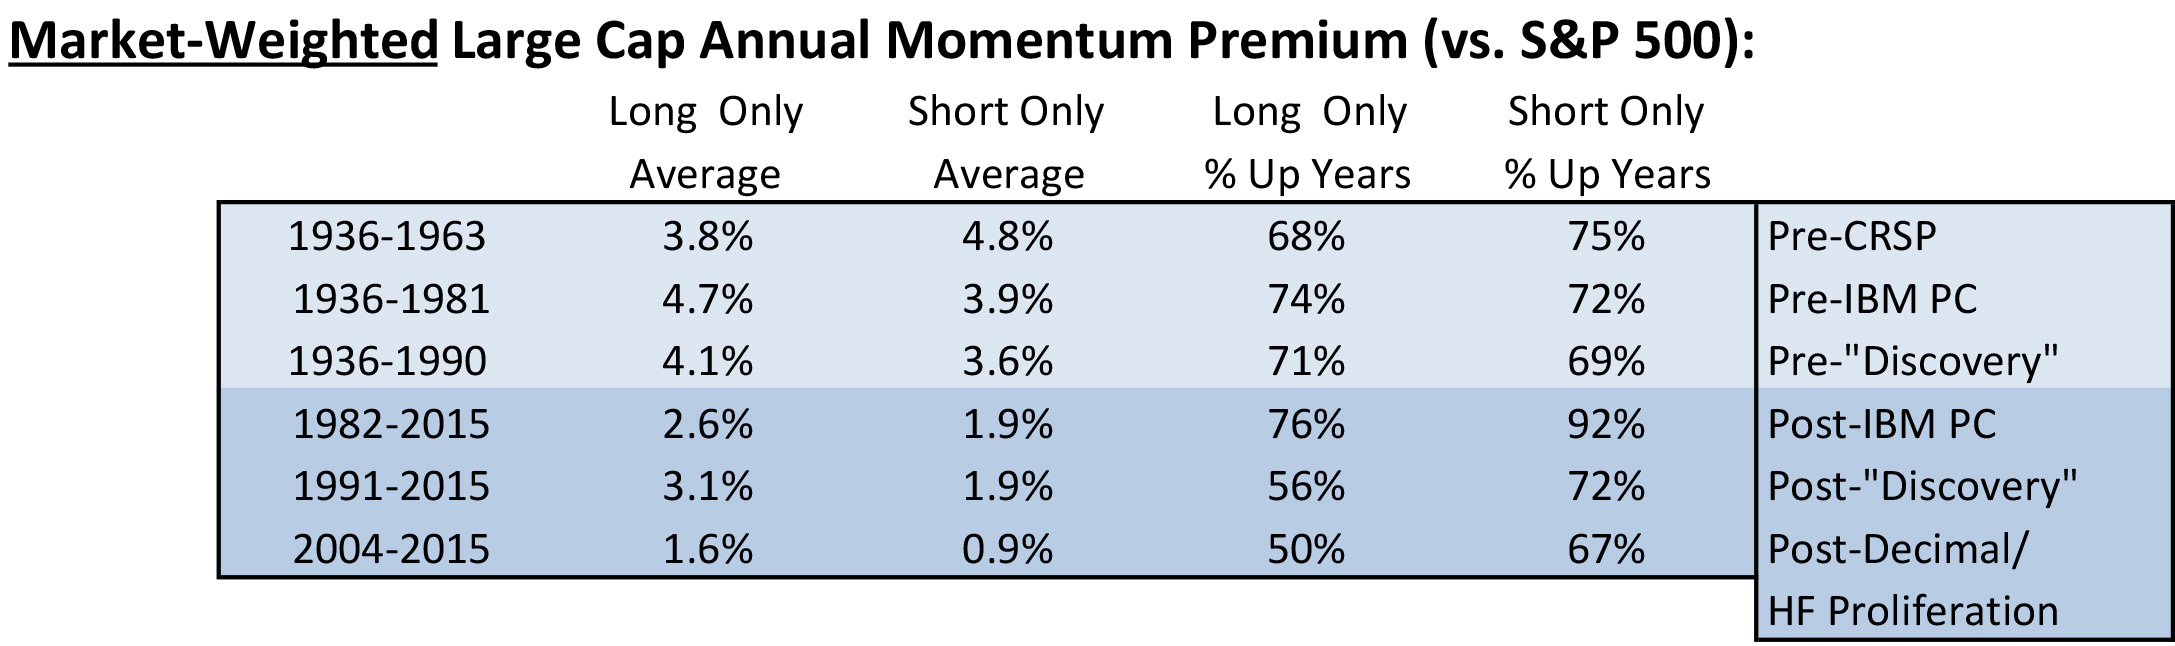
Table 3: Long and short equal weighted momentum premiums for various time periods.
Bear Markets
Another reasonable explanation for the momentum premium drop-off is the 1930s-style bear market that occurred in 2008 to 2009. According to Ned Davis, the 2008 to 2009 bear market, which saw the S&P 500 index fall 57% from its high, was the second worst U.S. bear market in modern history.14 The worst by far was the 1929 to 1932 bear market, where the S&P 500 fell by 86%. At the bottom in July of 1932, the S&P 500 shot up 111% in two months, followed by a five-month decline of 41%, before stocks finally resumed the long march higher.
Bear markets are generally a bad environment for momentum, with the worst damage occurring after the market bottoms and a new bull market emerges. That’s not surprising since a momentum-based portfolio is positioned in the worst possible way when the market bottoms – heavily loaded with safe defensive stocks, and short the most levered, risky stocks that have fallen the hardest during the bear market. For this reason, the momentum premium is typically significantly negative during the first 12 months of a new bull market.
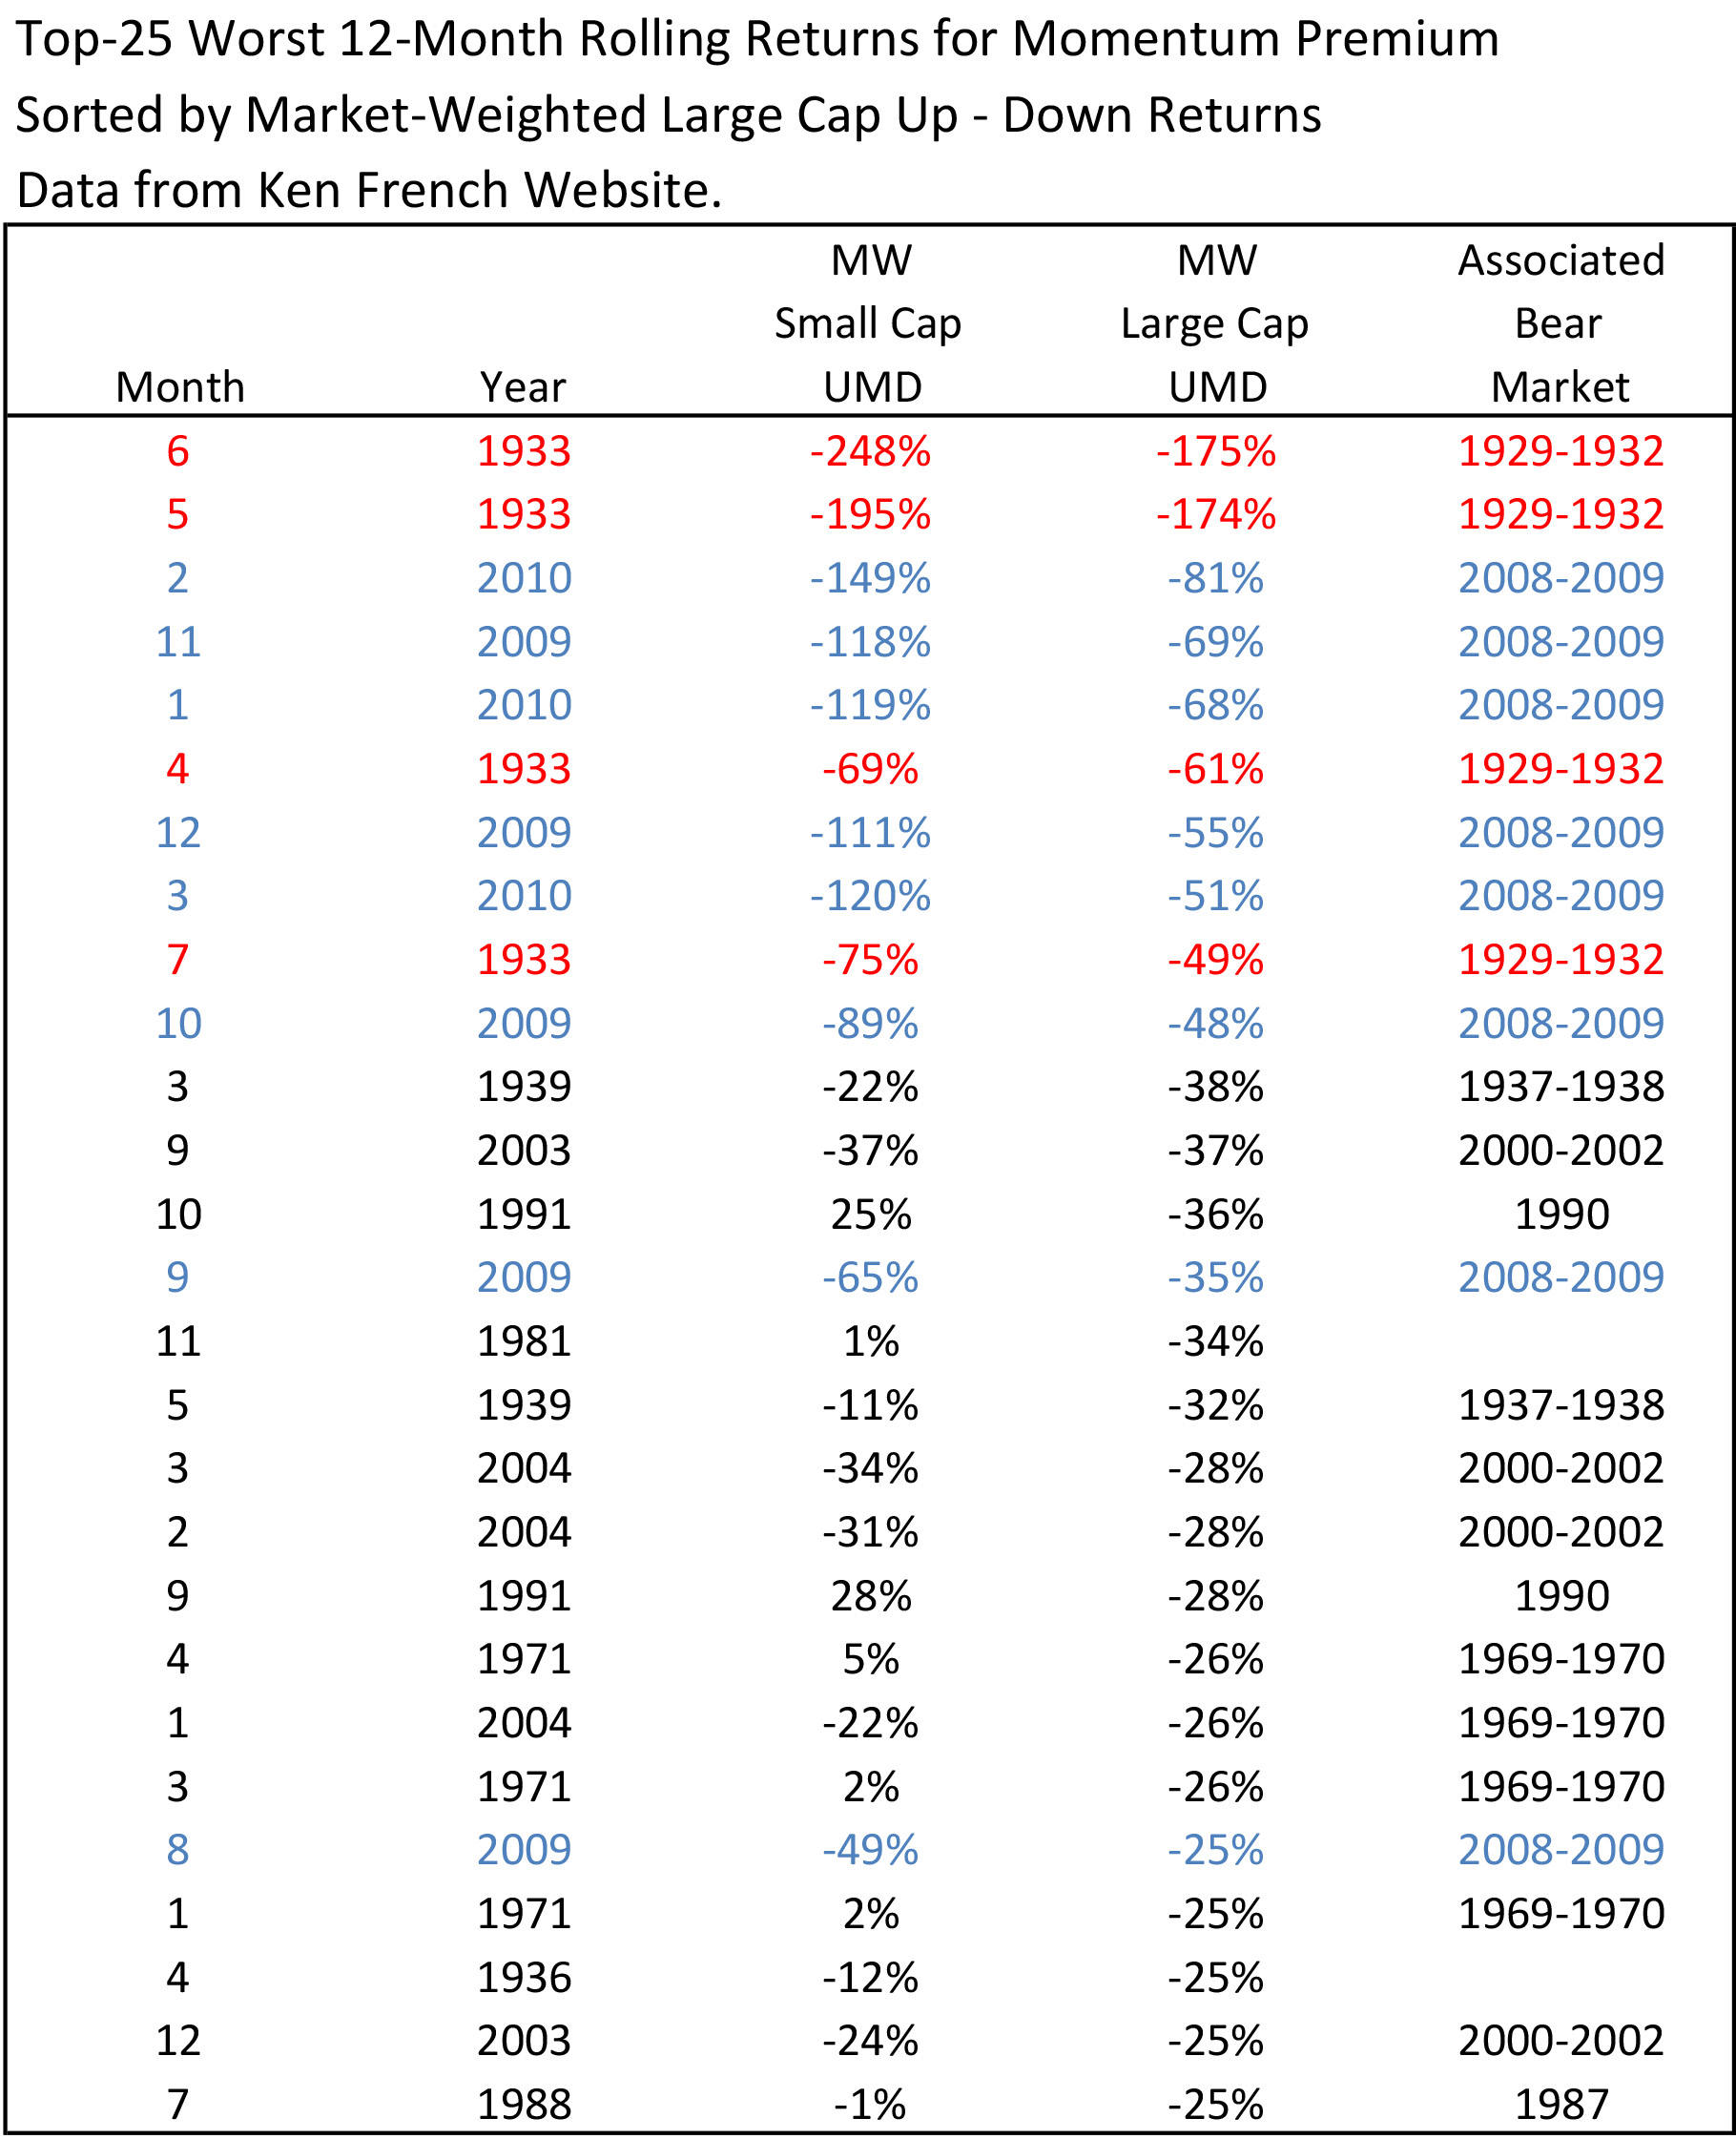
Table 4 shows the worst 12-month rolling returns associated with the momentum premium. Notice that the top 10 worst 12-month rolling periods are all associated with either the 1929 to 1932 bear market (highlighted in red) or the 2008 to 2009 bear market (highlighted in blue). Perhaps we can argue these bear markets are 1-in-50-year occurrences. Perhaps this ugly performance is the “risk” associated with momentum, and thus the momentum premium is an enduring above-zero premium, and mass-adoption leads only to more volatility. I suppose an investor could just take a calculated bet that such a bear market will not occur again in their lifetime, and comfortably use momentum in their investment portfolio.
I have my doubts about any of the above ideas since this sort of pain is avoidable for any good asset class trader. When stocks are down 30% or more, it’s pretty easy to say we’re experiencing a bear market. No foresight is required since the drawdown already occurred. The only question is how much further do stocks have to fall and at what point in time does the new bull market start.
When stocks are down 30%, I’m looking to buy things, not short them. Why buy things? Because generally there’s panic and despair in the air, which probably means there are various motivated selling opportunities to exploit. Valuations are generally excellent, corresponding to high future expected returns, and risky assets as a whole are very underowned.
Anyone who remains short throughout a bear market is either inexperienced or extremely headstrong since they are betting on the Armageddon scenario that rarely plays out. When stock markets are down greater than 30%, the prudent thing to do is eliminate all shorts, and if you don’t want to buy, then sit in cash. Yes, perhaps there is a little more to gain as stocks fall further, but when the market bottoms, stocks can rebound violently in a matter of days. The high volatility near market bottoms also makes it hard to stick with these shorts, leading to one of those frustrating situations where you were right about stocks falling much further, but didn’t make any money with that insight.
Go to cash and wait to buy. Turn off anything that’s an effective short. Sell long-term treasuries if they are bursting higher as stocks collapse. Momentum also falls into this category. It makes no sense to hold either the long portfolio or the short portfolio once a bear market has established itself. When the new bull market emerges, the short portfolio will rocket higher, while the long portfolio will significantly lag market indices.
The bottom line is that if stocks are down 25-30% from the high, turn off momentum. All the ugly periods shown in Table 4 are associated with the first year of bull markets. It’s not that difficult to develop a mechanical trading rule based on this principle.
Table 4: Top 25 worst 12-month momentum premium returns.
Tables 5 and 6 show what happens to the momentum premium when 2009 returns are eliminated from Tables 2 and 3. The premium associated with shorting stocks shows no degradation, while long momentum continues to show a slight degradation. The success rate for long momentum also continues to show degradation. It’s not really fair to eliminate the worst year, but since it’s possibly avoidable, I suppose we should be open-minded that momentum can still be very useful with bear market modifications.
Table 5: Long and short market weighted momentum premiums for various time periods (excluding 2009).
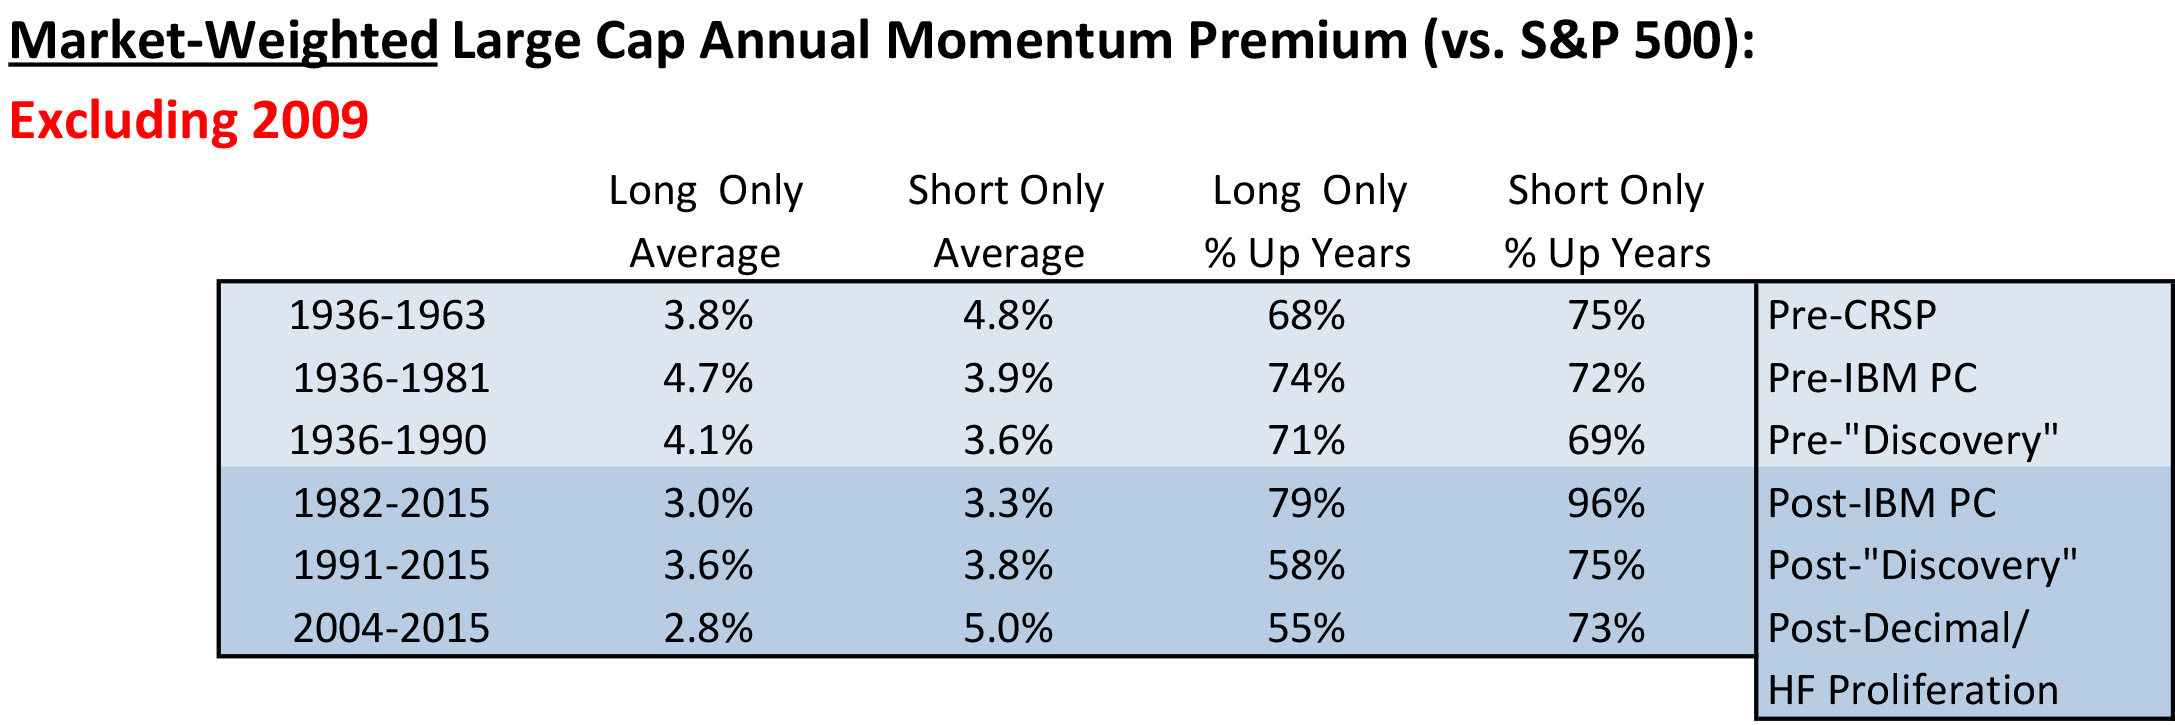
Table 6: Long and short equal weighted momentum premiums for various time periods (excluding 2009).

Analysis of the AQR Momentum Funds
The AQR momentum funds have been in existence since July 2009. AQR is very sophisticated, and if anyone can find a way to implement momentum and engineer low transaction costs, it’s them. Table 7 shows the performance of their momentum funds from 2010 to 2016. While the inception dates were in mid-July 2009, starting in 2010 provides two advantages for this analysis. It avoids 2009, with its poor momentum returns, and it avoids inefficiencies associated with managing a fund start up with very low assets.
Table 7: AQR momentum funds performance.

While not a long time frame, we can nonetheless see how these funds have done as a practical real-life test in harvesting the Up-momentum premium. Over this seven-year period, all the AQR momentum funds (U.S. Large, U.S. Small, International) have failed to add value after transaction costs and fees. Even the no-fee, no-transaction cost Fama-French momentum series have barely beaten their benchmarks. In the small cap space, I used the Vanguard small cap ETF as a benchmark to avoid using the ubiquitous Russell 2000 benchmark, since reconstitution costs associated with the Russell 2000 are large.
I don’t know what excuse the momentum proponents can give for this disappointing performance, especially when backtested FF momentum premiums of 5%+ per year looked so attractive and robust. There were no severe bear markets during this time period, although there were two very mild bear markets in 2011 and 2015. The “it’s too short a time period” excuse is probably their best argument.
Considering the volatility in the long-term charts of Figures 1 and 2, this argument would probably still have some weight even with another seven years of lackluster performance. Value and small cap premiums have certainly underperformed over seven-year periods in the past, so for some investors, continuing to use momentum funds will make sense, especially since momentum and value premiums have historically been inversely correlated with each other. Yet value and small cap stocks are asset classes that get cheaper with underperformance. Momentum is a high-turnover trading strategy that doesn’t get any cheaper with poor performance.15
The only positive shown in Table 7 is the comparison of the MSCI All Country World Index (ACWI) momentum index with the MSCI ACWI. Over this time period, the momentum screen nicely overweighted U.S. stocks versus international stocks over a period of extended U.S. equity dominance. This is certainly a momentum-based trading success during a period were momentum has struggled in most markets.
Conclusions
The evidence is mixed and each trader and investor must decide for themselves.
On the negative side, it appears that the momentum premium is falling over time in line with the relaxation of implementation costs. The AQR momentum funds have failed to add value since inception, suggesting that the momentum premium has been completely arbitraged away after costs and fees. Logic also suggests that the momentum premium should go away when heavily adopted because it’s a low capacity, high-turnover, liquidity-demanding trading strategy. The best explanations for why momentum works are behavioral rather than risk-based. Unlike value or small cap premiums, momentum does not get cheaper as it underperforms. It’s not surprising the premium is going away after fees and transactions costs.
On the positive side, some may interpret the dramatic reduction in momentum premium as within the “noise” of the long-term volatility of the premium. The time frame of this evaluation is too short, so maybe we are on the verge of a surge in the premium. Perhaps the premium reduction is due to the 1-in-50-year explosive recovery of low momentum stocks after the 2008 to 2009 bear market, suggesting a normal premium in the future. Within a global stock arena, momentum has done quite well versus the MSCI ACWI during a period of poor momentum returns most everywhere else.
Speaking as an investor, I suppose we can continue to use momentum because it’s such a strong effect and we’ll never know the status of the arb firepower versus momentum capacity. Even if the future momentum premium is lower, less reliable and volatile, it could remain above zero over the long-term.
Speaking as a trader, I suppose we can take an analogous view – don’t bet on momentum directly, but if it lines up with our other trading edges, then it’s providing icing on the cake to justify a trade. We could also use momentum to avoid underperforming assets, but we should already be doing that by other means if we are indeed asset class traders. And by all means, turn off momentum once a bear market is established.
I don’t like either of the above views. I lean toward not using momentum as either a trader or an investor. I expect the AQR momentum funds, and the newer momentum ETFs, to disappoint all those investment advisors who bought the sales pitch. The quant factor-based investing trend is very strong right now and dangerous for the momentum premium. Those providing momentum premium exposure for a fee should be able to craft a nice “stay-the-course” justification claiming that 5 to 10 years is too short a time frame to make a judgment.
Can we generalize these views towards ranking asset classes based on momentum? I suppose there is more capacity associated with trading asset classes, along with more performance chasing and asset allocation delays among investors. However, the ETF revolution has created an ETF for just about any reasonable way to slice and dice equity and bond markets. Commodity and currency futures have been around for decades. There’s one ETF that uses momentum to trade global ETFs – the $40 million Cambria Global Momentum ETF (Symbol: GMOM). The five FundX mutual funds trade ETFs based on momentum and control greater than $400 million in assets.16 Global macro hedge funds manage over $200 billion in assets.17 I would avoid using momentum to rank asset classes; all signs suggest this approach will not add value in the future.
References
- Asness, C.S., Frazzini, A., Israel, R., Moskowitz, T.J., “Fact, Fiction and Momentum Investing”, J. Portfolio Management, fall 2014.
- Asness, C., Moskowitz, T., Pederson, L., “Value and Momentum Everywhere”, Finance Vol. 68, pp. 929-985, 2013.
- Jegadeesh, N., “Evidence of predictable behavior of security returns”, Finance Vol. 45, pp. 881–898, 1990.
- Ken French, Dartmouth University, http://mba.tuck.dartmouth.edu/pages/faculty/ken.french/data_library.html
- Geczy, C. and Samanov, M., “212 Years of Price Momentum (The World’s Longest Backtest: 1801-2012)”, Working Paper, Univ. of Pennsylvania – The Wharton School, 2013.
- Jegadeesh, N. and Titman, S., “Returns to Buying Winners and Selling Losers: Implications for Stock Market Efficiency,” Finance, Vol. 48, pp. 65-91, 1993.
- Asness, C.S., “Variables that explain stock returns”, Ph.D. Thesis, University of Chicago, 1994.
- O’Neil, W.J., How to Make Money in Stocks, 2009.
- Fund Exchange, https://fundx.com/Performance.aspx.
- Moskowitz, T., “Explanations for the Momentum Premium”, AQR, summer 2010.
- Novy-Marx, R., “Fundamentally, Momentum is Fundamental Momentum”, No. w20984, National Bureau of Economic Research, 2015.
- Novy-Marx, R. and Velikov, M., A taxonomy of anomalies and their trading costs, NBER Working Paper 20721, 2014.
- Frazzini, A., Israel, R., Moskowitz,, T.J., Trading Costs of Asset Pricing Anomalies, Working Paper, University of Chicago, 2013.
- Ned Davis Research Report T_201B.RPT, www.ndr.com.
- Tilley, D., “Asset Class or Trading Strategy?”, Asset Class Trading Blog, 2015. http://www.assetclasstrading.com/2015/07/13/asset-class-or-trading-strategy/
- www.morningstar.com.
- BarclayHedge, http://www.barclayhedge.com/research/indices/ghs/mum/HF_Money_Under_Management.html.
Disclosure
The content contained within this blog reflects the personal views and opinions of Dennis Tilley, and not necessarily those of Merriman Wealth Management, LLC. This website is for educational and/or entertainment purposes only. Use this information at your own risk, and the content should not be considered legal, tax or investment advice. The views contained in this blog may change at any time without notice, and may be inappropriate for an individual’s investment portfolio. There is no guarantee that securities and/or the techniques mentioned in this blog will make money or enhance risk-adjusted returns. The information contained in this blog may use views, estimates, assumptions, facts and information from other sources that are believed to be accurate and reliable as of the date of each blog entry. The content provided within this blog is the property of Dennis Tilley & Merriman Wealth Management, LLC (“Merriman”). For more details, see the Important Disclosure.